Revista Electrónica de Investigación Educativa
Vol. 5, No. 1, 2003
Admissions Tests and the Probability of Academic
Success in Higher Education. A Study in a
Mexican State Public University
Ragueb Chain Revuelta
(1)
rchain@uv.mx
Nicandro Cruz Ramírez
(2)
ncruz@lania.mx
Manuel Martínez Morales
(3)
manuelmm69@hotmail.com
Nancy Jácome Ávila
(1)
njacome@yahoo.com
1
Instituto de Investigaciones en Educación
Universidad Veracruzana
Diego Leño 8, C. P. 9100
Xalapa, Veracruz, México
2
Laboratorio Nacional de Informática Avanzada, A. C.
Rébsamen 25, C. P. 91000
Xalapa, Veracruz, México
3
Departamento de Inteligencia Artificial
Universidad Veracruzana
Sebastián Camacho 5, C. P. 91000
Xalapa, Veracruz, México
(Received: November 14, 2002;
accepted for publishing: March 21, 2003)
Abstract
The growing demand for admission to institutions of higher education, combined with the decreasing availability of the academic supply, has increased the need to apply selection criteria, among which are entrance examinations. This work shows an approximation of the relationship between students’ results in the areas of knowledge explored by the National Examination for Admission to Higher Education (EXANI II), and their scholastic trajectory. Analyzed was information available for the 1998 EXANI II results, and the academic path of 6,937 freshman students at The University of Veracruz (UV). For the analysis, conditional independence tests, as well as simple correlation tools were used. Without exhausting all the possibilities, analysis of the data suggests the degree of association between the examination scores and university performance.
Key words: Entrance examinations, performance, higher education.
Introduction
Higher education institutions (HEIs) face a growing demand for new entry in a context of slower growth speed. Consequently, to the extent that demand exceeds supply, institutions have had to establish transparent and objective mechanisms that permit them to decide, on the basis of the best available criteria, who will be admitted. In this regard, a significant number of institutions have opted to apply entrance examinations, considering that these instruments not only permit them to categorize students on the basis of their performance as compared with the group taking the (standard) test, but also provide guidance concerning the mastery of contents and skills identified as relevant to higher education.
On the other hand, although it is recognized that success in school is the result of many factors interrelated in various ways (Martinez, 1989; Chain, 1995), there is an assumption, not always demonstrated, that behind the possibility of ordering and indicating the mastery of content through entrance exams lies the belief that applicants for admission having higher scores on the test will consequently have a greater probability of success as college students.
When it is intended that there be admitted those students with the greatest chance of success in school, predictive validity is a desirable characteristic usually deemed relevant in the entrance examinations (Martínez Rizo, et al., 2000). Therefore, it is advisable to explore this by means of careful studies, to the extent that ensuring a greater predictive validity for a test helps guarantee a greater objectivity in the selection processes. We believe that a test that does not achieve a certain level in this aspect opens the door to a deficiency in selection, which can generate a waste of resources, because students having a low probability of success consume a large amount of the IES’s meager resources.
The majority of the studies oriented toward an analysis of the predictive capacity of the admissions examinations are conducted with samples, or in the best of cases, with reduced populations. On the other hand, these studies are done using focuses that seek to demonstrate statistically the degree of association between variables, the scores obtained on the examination, and the final average of grades in the undergraduate degree program.1 However, research done on complete populations, oriented toward exploring the ability of the examinations to distinguish between students with high or low probability of success, or their general predictive value, are still scarce. An analysis of this type would require a careful experimental design, and following a sample of students throughout their university trajectory.
From our perspective, using a data-analysis approach different and apart from attempting a strict study on predictive validity, reasonable approximations can be built around the degree of association between the areas of knowledge considered in the admissions test and the academic path of students who entered The University of Veracruz (UV) in 1998. In this sense, the focus is on determining whether it is possible to calculate the probability of scholastic success based on grades obtained on the entrance examination used applied the UV, beyond demonstrating the degree of correlation which, while it indicates a certain trend and the strength of it, rules out the determination of what variables are more or less relevant for determining the best possible approximation of the probability of scholastic success.
I. Methodology
The study group considered was a group of students who applied and were admitted to the University of Veracruz in 1998, and who took the entrance exam EXANI II prepared by the National Center for the Evaluation of Higher Education (CENEVAL). This group was made up of 6,937 students from 42 of the 60 programs offered by the UV, distributed over the five zones.
For each of the students the total number of correct answers on the entrance examination (EXANI II) was compiled, and grades in terms of percentage of correct answers were obtained in each of the areas of knowledge considered on the test: verbal reasoning (VR), numerical reasoning (NR), contemporary world (CW), natural science (NC), social science (SS), Mathematics (MATH) and Spanish (SPAN).
On the other hand, to construct a measurement of school performance, the overall average scores obtained by these students were collected up to the third semester, as well as another set of indicators related to each student's schooling: continuity, a passing grade for the ordinary examination index, and the promotion index.
To measure the association between the areas of the admissions exam and performance in the UV—which we call the scholastic trajectory or academic path—two approaches were used. First, using conditional independence tests applied to the scholastic trajectory and the fields of knowledge expressed in categories or classifications described below, which indicate the association between the variables, determine what areas of knowledge are associated with the school trajectory, and consequently achieve an approach to determine the probability that having obtained a certain grade, the student would achieve a particular type of academic path. Second, through measurements of correlation applied to the college grade point average, and the examination scores in their original scale, that is, the percentage of correct answers.
The two measures provide complementary information: the conditional independence tests permit the evaluation of probabilities for school trajectories, given the different categories of fields of knowledge, while correlation coefficients are more popular and offer a measure of linear association between the variables studied, which reflects the degree of influence of one variable on another.
II. The variables
2.1. Score on the entrance examination
To carry out the analysis by means of conditional independence tests, the available information regarding test scores was processed to discretize it based on categories. To do so, from its particular distribution (Table II) three categories were determined. Thus, when the score in a field of knowledge is equivalent to, or less than that corresponding to quartile 1, it was classified as (low); a score higher than quartile 1, but lower or equal to quartile 4 was defined as 2 ( medium); and a score higher than quartile 4 would be 3 (high). Table I reflects this classification for the different fields of knowledge explored by the EXANI II.
Table I. Fields of knowledge
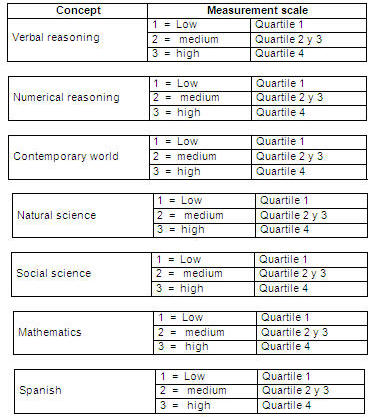
Table II. Statistics of examination grades

2.2. Performance Indicators
The dependent variable, which we call scholastic trajectory at the university, was constructed based on three basic indicators: the ordinary examination index (OEI), the rate of promotion (IP) and average (AVG). Table III expresses each concept and describes the procedure for calculating it. Also, based on their special distribution (Table IV), three categories2 are defined in each case. For example, an index of less than 80% of courses passed was classified as 1 (low); while if it were in a range between 80% and 89%, it was defined as 2 (medium); and when it was between 90% and 100%, it was classified as 3 (high).
Table III. Indices of scholastic trajectory

Table IV. Statistics on scholastic performance indicators

Tables V, VI and VI show the distribution of the performance indicators based on each of their categories (low, medium and high). In these can be seen some of the features that characterize the performance of students in the undergraduate program. Nearly half of the students presented a passing index of less than 80% for the ordinary examination, which is to say that they passed fewer than 8 out of 10 of the subjects they were taking, while just over one third passed all the courses in which they were enrolled (Table V).
Table V. Index of passing the ordinary examination

However, while passing the ordinary examination shows that students are not promoted the first time they take some subjects, the fact that three-quarters have a promotion index of 100%, i.e., passing 10 out of 10 subjects studied, indicates that there is a tendency to pass the subjects the second time around (Table VI).
Table VI. Promotion index

On the other hand, it is evident that only a fifth of the students achieved an average above 85, while twice that number, two-fifths, obtained averages lower than 75 (Table VII).
Table VII. Average scores

2.3. Scholastic trajectory
From these three indicators is constructed the concept scholastic trajectory; the procedure for classifying the trajectory of each student is carried out based on the particular combination of categories he achieved in the three indicators mentioned above.
In this sense, Table VIII indicates that those students classified in OEI = 1 (low), PI = 1 (low) and AVG = 1 (low); add three points and his academic path is classified as trajectory 1 (low); i.e., his index for passing is lower than 80, his promotional index is less than 90, and his grade-point average is below 75 (see student enrollment 98010012 in Table VIII).
At the other extreme is a student who is classified as OEI = 3 (high); PI = 3 (high) and AVG = 3 (high), totaling nine points, and his trajectory is identified as high, since as well as passing all the courses on the ordinary examination, and therefore being promoted from all of them, his average is higher than 85, student enrollment 98010084 in Table VIII.
Table VIII. Indicators and categories

As shown in the example above, each student is classified in a category of scholastic trajectory based on the combination of the indices she has obtained; in any case the range of possibilities goes from three (low, low, low) to nine (high, high, high) according to Table IX:
Table IX. Indices and trajectory

Tables X and XI describe the distribution of students according to the combination of their indices and the classification of their scholastic trajectories, respectively. In this sense, at one extreme 12.11% of students are characterized by their low indices of passing the ordinary examination and in promotion, as well as an average below 75, while 18.64% achieved high indices in both aspects, and an average of more than 85.
Table X. Distribution according to the combination of index and trajectory

In the perspective of scholastic trajectory it is evident that more than a third of the students have developed a high trajectory, characterized by passing grade indices on the ordinary examination and by promotion or averages ranging from medium to high (see Table XI).
Table XI. Distribution of scholastic trajectory by categories

While the sum of the indices of scholastic performance permits the construction of a first classification of scholastic trajectory, it can be described better if the trajectory is combined with the indicator of continuity or discontinuity. This refers to the time when the expected credits are completed on the basis of the courses taken. In other words, a student is defined as continuous when he has covered each and every one of the courses for the accreditable semesters, as described in Table XII:
Table XII. Indicators of continuity and discontinuity

Consequently, the combination of experience (low, medium or high) with the condition of continuity in the studies allows greater precision in the definition of student types. This is not gratuitous if we consider that a student who has passed all subjects on the ordinary examination (100% of them) has obtained an average greater than 85; moreover, she has advanced in her studies as expected in the enrollment periods, differs from another student who has reached the same indicators, but has only partially covered the number of courses she should have. In our case study, we do not consider that the scholastic trajectory of a student classified as high, but who has covered all the subjects in the third-semester curriculum, could be considered equivalent to someone who, even having a high trajectory, has managed to complete only the first semester.
Table XIII shows the types of trajectories we have constructed for this study; at one extreme are located type-1 students, characterized by a low trajectory and who have not covered the courses expected of their class; at the other end are those are characterized by a high trajectory and the accreditation of all the courses.
Table XIII. Scholastic trajectory and continuity

Overall, 58% of students have developed a continuous trajectory to the third semester, while 42% have advanced in the BA/BS program, but without covering all the courses which are part of that educational program. In terms of the six types of trajectories constructed, the distribution indicates that students tend to be concentrated at the extremes: type 1, i.e. a low and discontinuous trajectory (27.35%); and Type 6, characterized by a high and continuous trajectory (28.93 %).
Table XIV. Distribution of the types of school-continuity trajectory

III. Results
3.1. Analysis of conditional independence
To investigate the structure of the association between scholastic trajectory and the results in the fields of knowledge, there were applied conditional independence tests based on methods and algorithms of artificial intelligence (Cruz Ramirez, 2001), indicating which of the explanatory variables (VR, NR, CW, NS, SS, MATH, SPAN) provided more statistical information on the dependent variable (trajectory) and which were those whose contribution had little relevance when considering the most influential variable (Pearl, 1998). Based on these tests we were able to construct a graphic model that represented a probabilistic network (Jensen, 2001), epitomizing the structure of the interrelationships of the dependent variable and independent variables, as well as the mutual interactions between the latter. The nodes of the graph represented the variables, the arcs represented the association between variables, and the absence of an arc between two variables meant that they were conditionally independent, given all other variables (Figure 1). According to these results, the two most important variables associated with the trajectory were verbal reasoning (VR) and Spanish (ESP). Once these variables had been considered, added information on another did not significantly modify the probabilities of the different values of the variable trajectory. That is, calculated the probability of a type of experience with these two variables, the inclusion of any of the others did not add more information for discriminating between those who achieve one or another scholastic trajectory.
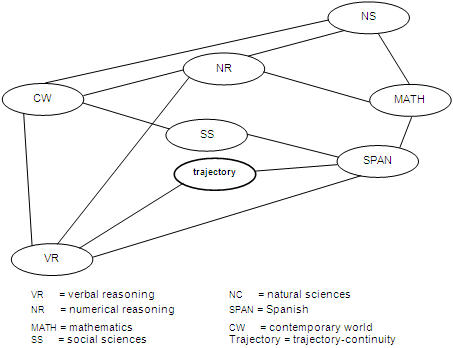
Figure 1. Graphic model of the probabilistic network
Table XV presents the conditional probabilities for different levels of the variable trajectory-continuity in relation to the extreme values of the variables verbal reasoning (VR) and Spanish (SPAN).3 The data indicate a set of clear trends. For those with low scores on both areas of the examination there is a greater probability of developing a type-1 trajectory characterized as discontinuous and low, that is, with a lower index of passing the ordinary examination, lower promotion index, and a low average; Thus, 34% of those who got low grades in the above areas had a low trajectory.
In contrast, when both scores were high, the greatest probability definitely moves towards a type-6 trajectory, and continues high, characterized by a high index of passing on the ordinary examination, total promotion, and an average of above 85. Thus, for students high in these areas, there is twice the probability of a type-6 trajectory reaching 46%. Also reduced in the same proportion is the probability of obtaining a type-1 trajectory, compared with students with low performance on the examination, since only in the case of the high performers is the probability of trajectory 1 reduced to 15%.
The probability distribution for students, based on their performance (high or low), allowed us to confirm that those with scores above the third quartile in VR and SPAN were more likely to register a very good trajectory, as compared with those who developed an achievement below the first quartile, in both fields of knowledge.
Table XV. Probability of scholastic trajectory for students
with low and high grades in VR and SPAN*

Adding the percentages of Table XV in relation to continuity or discontinuity it can be seen that for students with low grades in both fields of knowledge the probability of being continuous, i.e., types 4, 5 and 6, reaches 55%. This proportion increases to 62% in the case of students, also 4, 5, 6, who combine high scores. Furthermore, for the first, the probability of continuity with low trajectory (type 4) reaches 15.32%; for the second, this probability is reduced to 4.59%. The above shows that it is much more likely for a student with low grades in VR and SPAN to be characterized by a continuous trajectory, but low in terms of passing, promotion and average, than for a student with high grades.
On the other hand, while probably 50% of students with low grades reflect a low trajectory (types 1 and 4), this probability is reduced to 19% for those with high grades.
Similarly, for those with low scores, the likelihood of a high trajectory, although discontinuous (type 3), is only 2%, while for those with high grades the probability rises to 16.25%.
Table XV aims to exemplify the extremes, the set of how the pertinent probabilities are distributed for each combination of levels (high, medium and low), obtained in VR and SPAN. They clearly show the trends showing that a better performance on the examination increases the probabilities of obtaining a better trajectory in college.
It is necessary to consider that the association itself is not sufficient to guarantee the predictability of the academic path based on the scores on the admissions examination; however, it indicates clearly enough that those areas are the most informative about students’ future performance in their college trajectory.
On the other hand, we can say that the knowledge fields NR, MATH, SS, NS, and CW do not have a direct bearing on the school trajectory, but show an association with VR and SPAN, and between them. However, the relevant issue is that the best calculation of probabilities of educational success can be done without incorporating them, that is, the areas VR and SPAN are sufficient to achieve the best approximation when one wants to know the probability that certain examination grades result in a predetermined trajectory. In this sense, the absence of a direct relationship of these fields of knowledge with the school trajectory indicates that their use to calculate probabilities does not contribute to achieving better approximations.
Tables XVI and XVII show us, for example, what happens if the variable social sciences is also considered. The statistical test performed indicates that the trajectory probabilities with VR and SPAN given, do not change significantly when we introduce the new variable.
Table XVI. Probability of scholastic trajectory for students
with low grades in VR, SPAN and SS

Table XVII. Probability of scholastic trajectory for students
with high grades in VR, SPAN and SS

3.2. Simple correlations
Table XVIII shows the simple correlations between the variables college GPA (AVG) and the percentages of right answers in the fields of knowledge (VR, NR, CW, NS, SS, MATH and SPAN). We observed that verbal reasoning and Spanish are the variables having the highest correlation with the average. The correlations r(AVG, VR) = 0.24 and r(AVG, SPAN) = 0.22 are statistically significant; they indicate only the trend, although the association is not as significant in terms of guaranteeing predictability.
Table XVIII. Simple correlations

It can be seen that the structure shown in Figure 1 is consistent with the associations detected in the analysis of correlation. The application of both procedures shows that the variables most strongly associated with trajectory are VR and SPSN; the others contribute no additional information about the trajectory, given the first, more than through their association with these.
IV. Conclusions
The results of this work point to several things we must consider. First, highlight the fact that the scholastic trajectories are extremely varied and complex, so that it may be appropriate to construct them by means of a set of indicators; doing it that way allows us to consider in studies of school performance the diversity of trajectories students display as they pass through the university.
Second, take the trajectory as a variable in place of the grade point average, although including this permits working with discrete variables and applying new forms of analysis to the available information, such as measurements of conditional probability.
Third, the results found allow us the reasonable assumption that of the set of areas explored by the entrance examination, two permit the best calculation of probability for obtaining a type of trajectory, and that considering the other areas does not provide more information for the calculation. If we assume the above, it is easy to accept that it may be appropriate to give the areas of Verbal Reasoning and Spanish a greater weight on the examination, whether by means of a more in-depth exploration achieved by increasing the number of questions or, attributing greater weight to them in the score given.
Fourth, although the data show the association between the type of trajectories and qualifications in VR and NR, this in no way confirms that the degree to which it can predict a trajectory would be definite; in any case there is a clear trend which permits an approach to the topic. But it is also necessary to recognize that the foregoing occurs because the trajectory is not associated exclusively with the test scores. It is generally accepted that it can be associated with different variables or characteristics of the learners. It is enough to think, for example, that a student with good grades on the examination may lack substantial support to devote himself to full-time studies. The above leads us to believe that a serious study of the predictive validity of a test must be more complex.
In this regard, a previous study of similar characteristics (Chain, Jacome and Rosales, 2000) indicated that the university trajectory was associated more definitively with the high school trajectory, including the average at that level.
It is evident that the degree of association measured by conditional probability provides an approximation; however, we must address a basic question in order to understand the results better. For example, to explain why 15% of the students with high grades in VR and SPAN are characterized by a low trajectory, and on the other hand, why the high proportion (22%) of students with lower grades are characterized by high trajectories.
In very superficial terms it is too easy to attribute this to the relative predictability of the examination; it is more interesting to look for more complex answers. In our case, for example, we found that of the 178 learners with lower grades and a high trajectory, only 15 (8%) are studying in the technical area, and therefore, in degree programs known for their degree of difficulty. While the vast majority are located in programs with a relatively lower degree of difficulty, this example indicates that studies on the predictive validity of admissions examinations will have to take into account another set of students’ aspects or attributes to explain the results. In short, these are not self-explanatory.
Finally, it is striking that two areas of the examination are enough in themselves to achieve a certain level of prediction for scholastic success; but it is even more important that when we try to suggest better admissions processes, we will have to work more accurately on studies aimed at analyzing the predictive validity.
References
Cruz Ramírez, N. (2001). Building bayesian networks from data: a constraint-based approach. Unpublished doctoral dissertation. The University of Sheffield, Sheffield, Great Britain.
Chain, R. (1995). Estudiantes universitarios: Trayectorias escolares. Mexico: The University of Veracruz-Universidad Autónoma de Aguascalientes.
Chain, R., Jácome, N., & Rosales, O. (2000). Estudiantes, exámenes y trayectorias. In CENEVAL, Memoria del Cuarto Foro de Evaluación Educativa (páginas 29-32). Mexico: Centro Nacional de Evaluación para la Educación Superior.
Chain, R., Martínez Morales, M. Jácome, N., & Rosales, O. (2001). Estudiantes, demanda y elección. Mexico: The University of Veracruz.
Jensen, F, (2001). Bayesian networks and decision graphs. New York: Springer-Verlag.
Martínez Rizo, F. (1989). Diseño de investigación para el estudio de la deserción. Enfoque cuantitativo transversal. In ANUIES, La trayectoria escolar en la educación superior (pp. 281-294). Mexico: Asociación Nacional de Universidades e Instituciones de Educación Superior.
Martínez Rizo, F., Backhoff, E., Castañeda, S., De la Orden, A., Schmelkes, S., Solano-Flores, G., et. al. (2000). Estándares de calidad para instrumentos de evaluación educativa. Mexico: Centro Nacional de Evaluación para la Educación Superior.
Pearl, J. (1998). Probabilistic reasoning in intelligent systems: Networks of plausible inference. New York: Morgan Kauffman.
Translator: Lessie Evona York Weatherman
UABC Mexicali
1 As an example, it is enough to point out that in the III, IV and V National Forums of Educational Evaluation convened by the CENEVAL, the works presented are characterized by a focus like the one mentioned.
2For these three indicators the scale relevant to each of the categories (low, medium and high) is defined based on specific criteria derived from the distribution of the indices.
3For these three indicators the scale relevant to each of the categories (low, medium and high) is defined based on specific criteria derived from the distribution of the indices.
Please cite the source as:
Chain, R., Cruz, N., Martínez, M., & Jácome, N. (2003). Addmissions tests and the probability of academic success in higher education. A study in a mexican state public university. Revista Electrónica de Investigación Educativa, 5 (1). Retrieved month day, year from: http://redie.ens.uabc.mx/vol3no1/contents-chain.html