Analytics and Gaps in the Use of Digital Platforms for Mathematics Education in Uruguay
 Eduardo Rodríguez Zidán Gustavo Bentancor Biagas Martin Solari
 How to cite: Rodríguez, E., Bentancor, G., & Solari, M. (2025). Analytics and gaps in the use of digital platforms for mathematics education in Uruguay. Revista Electrónica de Investigación Educativa, 27, e05, 1-17. https://doi.org/10.24320/redie.2025.27.e05.6438

Abstract
Uruguay is known for its early and sustained incorporation of programs that foster the use of digital resources in public education. The country selected the mathematics education platform Bettermarks to support student education. This research analyzes data on access to and use of Bettermarks for mathematics education among secondary school students both before and during the COVID-19 pandemic. A descriptive and inferential statistical approach was used to analyze historical data on individual student interaction with the online learning activities. The findings revealed a notable increase in the coverage rate, rising from 22% to 49% from 2017 to 2020. Similarly, an upward trend was also observed in the activities completed by active users in 2020. The platform provided greater coverage, but no significant differences were observed in the activity rate between years. The analysis tested several hypotheses to elucidate heterogeneities in access and interaction among students using the digital resources. Statistically significant differences were observed in coverage and student activities, based on different factors.
Keywords: pandemics, COVID-19, secondary schools, mathematics education
I. Introduction
Uruguay has gained prominence internationally thanks to ongoing advancement of public policies aimed at universalizing access to digital technologies and providing free internet coverage for teachers, students, households, and educational institutions since 2007 (Mateu et al., 2018; Pittaluga & Rivoir, 2012).
The CEIBAL initiative pioneered the implementation of large-scale policies for the incorporation of information and communication technology (ICT) devices and resources in the region (Lugo & Ithurburu, 2019). This widespread access to ICT in education has facilitated the creation of learning environments and classrooms with a significant number of devices, resources, tools, and educational platforms (Navarro et al., 2017; Ripani & Muñoz, 2020).
The most prominent initiatives that embrace the use of free digital tools for the educational community include the CREA (Content and Resources Platform for Education and Learning), the digital library, and two platforms for teaching mathematics: MATIFIC for primary education and the Adaptive Mathematics Platform (PAM) for both primary and secondary education. CEIBAL reports confirm a steady increase in digital resources available in recent years, along with a wide array of teacher training programs and projects for technological innovation that underpin widespread access to ICT from a perspective of social equity (Díaz et al., 2022).
A technical report from CEIBAL in December 2020 noted that, in that year, 100% of primary and secondary education institutions had internet connectivity and that CREA, the virtual learning environment platform, had reached 320,000 students and teachers from all subsystems. Additionally, in the same year, 130,000 students accessed and utilized PAM digital learning resources. Within this general context of digitalization of educational data, CEIBAL has made progress in professionalizing its data center and, in 2022, it established an observatory that includes a national catalogue of open data containing information on the educational platforms offered by CEIBAL to students and teachers between 2019 and 2022 (CEIBAL, 2022).
Nevertheless, and despite all the efforts made in the past 17 years in terms of training policies, universalization, and the availability of educational platforms and data on their use, pedagogical use of ICT was still in its infancy in the years preceding the pandemic, as reported by Cobo and Montaldo (2018), and is likely one of the most significant challenges posed by the emergency remote education system introduced at the onset of COVID-19 (ECLAC, 2020; Vaillant et al., 2022).
The research presented here was conducted within a context of universal and free access to digital technologies in Uruguay in the years preceding the outbreak of COVID-19, at a time when progress had been made in bridging gaps in access, yet there remained ongoing challenges regarding the pedagogical use of these resources in classrooms.
The overall objective of this project is to study the usage analytics of the PAM platform with the aim of providing evidence on the relevance of digital data for designing proposals for pedagogical interventions and customizing learning approaches for students.
Through the development of a data mining methodology that leverages historical usage records of PAM between the years 2017 and 2020, this work analyzes student behavior patterns and establishes relationships between variables that characterize the context in which digital tools are used for learning mathematics. This methodology entails the development of a process for collecting, systematizing and analyzing data on the student’s individual interaction with PAM’s online learning activities. Moreover, the present report provides insights into the different profiles of student access and interaction with the digital resources offered by PAM by comparing results from a context of compulsory education prior to and just after the interruption of face-to-face education (March 2020), based on the various social, demographic, and educational factors obtained from the CEIBAL databases.
1.1 Digital Platform for Mathematics Education in Uruguay
In Uruguay, the Bettermarks platform is referred to as the Adaptive Mathematics Platform (PAM, by its Spanish acronym). Since 2013, this platform has been made available to students and teachers in public lower secondary education. The platform tools were created by a German company that specializes in the design and development of educational software, and they have been adopted in various educational systems, both regionally and globally (Spitzer & Moeller, 2022; Stein, 2015). PAM provides over 100,000 exercises and other resources to help teachers to adapt their strategies to the pace and diversity of their students’ learning processes. In addition, it provides information on the frequency of access, type of activities, and number of completed series, in addition to student progress records and data from assessments conducted by teachers to evaluate students’ performance in the virtual mathematics classroom.
As detailed in the following sections, this results report presents a set of PAM access variables and login indicators, variables relating to students’ interactions with PAM, and information on the social and demographic context of both the students and the educational institutions.
The central hypothesis of our empirical approach is that the impact of the partial or total closure of schools and the transition from ICT-supported face-to-face teaching to virtual or blended education led to heterogeneities and different levels of use of digital resources. These heterogeneities are observed in variables associated with student access to and interaction with the PAM platform.
The article was structured around two blocks of questions based on the empirical variables extracted from the digital databases of PAM users.
Initially, a first set of PAM access variables was identified, and different indicators of use were created: login days, coverage, active users, access frequency, and period (during or prior to the pandemic). This initial phase of the empirical analysis was guided by the following questions:
- What were the patterns of student behavior and access to the PAM platform before and during the first year of the COVID-19 pandemic?
- Are there differences in terms of PAM coverage, active users, and take-up according to the grade levels of students in the years before and during the COVID-19 pandemic?
- Are there statistically significant differences in the use of PAM based on gender, school size, region, year, and grade level of lower secondary education students?
Subsequently, an analytical approach was applied to variables related to student interaction with this educational software (activity logs, completed series, stars and medals obtained by the students). This phase of the analysis was guided by this new block of questions:
- What social factors account for heterogeneities in the different modes of interaction between students and PAM?
- Are there statistically significant differences in students’ modes of interaction with PAM resources based on gender, school size, region, year, and grade level?
1.2 Related Work
A review of international literature, specifically on the use of digital technology in mathematics education, presents compelling evidence regarding the advantages it offers for teaching practice (Hillmayr et al., 2020; Olsher & Thurm, 2021). Several researchers highlight the efficacy of digital technology in providing multiple forms of representation of mathematical objects; supporting and strengthening experimental work and modeling real-world scenarios; fostering comprehension, meaningfulness, and interpretation of intra-mathematical and extra-mathematical problems; and facilitating the validation of results (Ball et al., 2018; Thurm & Barzel, 2022; Villamizar et al., 2020). Furthermore, the International Computer and Information Literacy Study (ICILS) 2018, involving eighth-grade teachers from twelve countries, found strong adherence to the use of digital technologies for teaching. Eighty-seven per cent of participating teachers believed that digital tools contributed to students’ personalized learning, 91% agreed that these technologies helped cultivate students’ interest in learning and 78% recognized that they enhanced collaborative work (Fraillon et al., 2019).
Nevertheless, digital technology relies on teachers’ pedagogical knowledge and appropriate implementation to fully leverage its transformative potential (Molina-Toro et al., 2019; Thurm & Barzel, 2022) and mitigate its negative effects (Fraillon et al., 2019).
Despite the evident benefits documented in the literature and the positive views expressed by teachers, integration of digital tools in mathematics education is still in its early stages, and their potential to transform pedagogical practices and the construction of mathematical knowledge is underutilized (Vaillant et al., 2019). Moreover, many teachers tend to focus on promoting technological skills rather than effectively combining technology with pedagogy to design student-centered pedagogical approaches that foster personalized and autonomous learning (Chiu & Churchill, 2015; Rakes et al., 2020).
Research conducted internationally by Area-Moreira et al. (2016) and in Uruguay by Rodriguez and Grilli (2019) revealed that, despite the widespread adoption of digital technology in classrooms, driven by the inclusion of technology in teaching policies, its use remains predominantly instrumental, characterized mostly by algorithmic exercises and basic use for visualizing and verifying results, with no significant advances towards a pedagogically meaningful use of digital tools or the adoption of student-centered approaches.
Researchers have indicated that increased use of educational platforms, particularly the Bettermarks platform (Spitzer & Musslick, 2021), can lead to improved performance of secondary school students (Ran et al., 2020). Such improvements may also be enhanced by the incentives offered by teachers (Spitzer & Musslick, 2021) and the customization of learning experiences according to students’ needs (Cullen et al., 2020).
1.3 Previous Studies on Bettermarks
There is prior educational research on Bettermarks, specifically within the education systems of Germany. A noteworthy research project, cited by the promoter of the platform, carried out a systematic comparison of online platforms (Stein, 2015) and found that Bettermarks outperformed other tools in terms of performance and adaptability in the various dimensions of mathematical problem-solving.
Subsequent field studies on Bettermarks have examined its impact on learning outcomes and the potential to predict the performance of students who use the platform. Performance prediction using a large volume of data is a key feature of the platform’s adaptability, while also serving to provide feedback to students and teachers. One study combines a knowledge representation graph with learning activities and objectives, together with a robust prediction system based on students’ interactions with the system, demonstrating enhanced accuracy in classification compared to previous systems (Stapel et al., 2016). The platform’s predictive potential was also addressed in a more recent field study conducted in the Netherlands, which highlights the significance of fraction learning as one essential mathematical skill that serves as a predictor of performance in algebra (Spitzer & Moeller, 2022).
During the COVID-19 pandemic, there were studies conducted that identified remote teaching practices during lockdowns. One such study surveyed teachers from Germany, Belgium, and the Netherlands (Drijvers et al., 2021). Findings revealed an increase in the use of videoconferencing tools, but a decrease in the use of specific tools for teaching mathematics. Differences were observed between the three countries due to the digital tools made available and the education policies within each system. While the use of mathematics exercise platforms (including Bettermarks) decreased in Belgium and the Netherlands, a slight increase was observed in Germany. Another study carried out in Germany in 2020 found that students who used the online exercise platform showed improved academic performance (Spitzer & Musslick, 2021), which was more significant among students with lower academic performance, demonstrating the platform’s gap-bridging potential.
II. Methodology
Since the rise of big data, the field of educational sciences, particularly applied educational research, has faced the challenge of systematizing and interpreting a vast array of records of use and digital data generated by students and teachers during their teaching and learning experiences in technological environments (Siemens, 2013; Suhirman et al., 2014).
Moreira Teixeira and Zapata Ros (2021) suggest that the study of large volumes of educational data calls for a thorough observation of patterns of use and for an emerging methodological approach based on artificial intelligence and personalized massive data analytics. Likewise, the Society for Learning Analytics Research defines the educational analytics approach as the measurement, collection, and analysis of large databases of student, teacher, and context data to comprehend and optimize learning processes and the environments in which they take place (Siemens, 2013; SoLAR, 2011).
The study presented here employs a data mining methodology based on the analysis of historical records of PAM use between 2017 and 2020. Patterns of student behavior were studied to establish relationships between variables that characterize the context in which digital tools are used to learn mathematics.
This approach made it possible to meet the following objectives:
- Analyze data on access to the PAM platform before and during the first year of the COVID-19 pandemic and determine whether there are any correlations with associated factors.
- Analyze data on student interaction with the PAM platform before and during the first year of the COVID-19 pandemic and identify heterogeneities in the use of the platform.
- Determine whether there are any correlations between the different modes of interaction and associated factors.
The empirical data mining method entailed a process to collect, systematize, and analyze historical data on individual student interaction with the online learning activities offered by PAM. Descriptive and inferential techniques were applied for classification, identification of patterns and outliers, and clustering, as well as statistical tests for the analysis of observed differences, such as Student's t-test and ANOVA.
The first step was to access a database provided by CEIBAL that is composed of two fields: student ID (anonymized) and calendar year (2017, 2018, 2019, or 2020). This Excel file contains a record for each unique combination of the two fields. The database has a total of 156,331 records (“login events”) from students who used PAM.
Each student attended a school and was enrolled in a specific grade level: seventh, eighth, or ninth grade, in lower secondary education. The database includes all PAM users for each grade level. Each student may have one, two, or three records in the database, depending on how many years he or she was enrolled in a grade level over the given period. In summary, the CEIBAL database comprises 113,102 different students and 265 educational institutions providing compulsory basic education, and it documents 156,331 PAM login events during the selected timeframe (Table 1).
| Year | 7th | 8th | 9th | Total logins | Schools |
|---|---|---|---|---|---|
| 2017 | 12971 | 9222 | 6784 | 28977 | 249 |
| 2018 | 11962 | 11193 | 7098 | 30253 | 248 |
| 2019 | 16526 | 11672 | 9046 | 37244 | 255 |
| 2020 | 22764 | 19666 | 17427 | 59857 | 265 |
| Total | 64223 | 51753 | 40355 | 156331 | |
| Source: Authors’ work based on the CEIBAL database. | |||||
For this dataset, CEIBAL provided a list of attributes from which a subset of variables included in the analysis model was selected. The metadata provided by CEIBAL consisted of records for 23 usage attributes and 8 grouping variables.
The first stage of the empirical work focused on analyzing logins to PAM through a descriptive and exploratory approach to the data. This analysis involved identifying measures of central tendency and measures of dispersion, as well as summarizing the variables related to access, coverage, and take-up of the platform. Subsequently, indicators of use and visual representations were generated to gain further insights into access statistics. Finally, hypothesis testing strategies were employed to determine the degree of association between PAM access and social factors.
In the second stage of the empirical work, the focus shifted to examining student-platform interaction by combining a descriptive approach with a subsequent explanatory analysis through pertinent hypothesis testing based on the measured variables. The analysis of the results relied on the use of specific software for large data volumes (SPSS Statistics V22, XLSTAT, and Weka) and on design and geographical distribution applications, such as Map in Seconds, to visualize variables based on the nineteen departments that constitute the territorial divisions of Uruguay.
2.1 Ethical Considerations and Data Analysis Limitations
The research is framed in the ethical principles of confidentiality, anonymization, and protection of the privacy of the individuals and institutions participating in the study. The datasets used for the analysis were prepared by CEIBAL’s Data Processing Unit in accordance with its organizational data privacy policy.
All data used in this research were previously anonymized in the identification fields for students and schools. The datasets do not include any personal information or information about the student’s performance in exercises on the platform. A confidentiality and information processing agreement was signed by the researchers responsible for the study.
The data presented in this article refer to an empirical correlational and census study. The findings should be interpreted within the framework of the limitations of the approach and the type of data collected, in particular the absence of individual student performance records to analyze the impact on learning. Likewise, it would be relevant to contrast the results with studies supported by mixed methodologies, in order to gain further insight into the effective use of technologies and platforms from a qualitative perspective.
III. Results
For the analysis of the database, three indicators were created: coverage rate (CR), active user rate (AUR), and take-up rate (TUR) of the PAM platform, based on user records (students who had logged in for at least one day during the academic year and engaged in some activity on the platform), active users (students who logged into the platform for a minimum of ten days throughout the school year), and enrolment.
In this study, the coverage rate is an indicator that expresses the number of users as a proportion of student enrolment. Similarly, the active user rate is defined as the number of active users as a proportion of the total number of users, and the take-up rate as the number of active users as a proportion of enrolment. All three indicators are expressed as a percentage.
Are there differences in terms of coverage, active users, and take-up of PAM based on the grade levels that students were enrolled in during the years prior to and during the COVID-19 pandemic?
One question addressed in this study was whether there were differences in the coverage, active users and take-up of PAM based on the grade levels that students attended in the years prior to and during the COVID-19 pandemic.
The main findings include a decrease in coverage rates as students progressed through the grade levels, a trend observed both before and during the COVID-19 pandemic. On the other hand, a higher increase is observed in the upper-grade levels when comparing coverage rates in 2019 (pre-pandemic year) and 2020 (the onset of the pandemic in Uruguay) for each grade level of lower secondary education. During this period, the coverage rate doubled in ninth grade, increased by approximately 67% in eighth grade, and exhibited the smallest increase in seventh grade (42.5%). Furthermore, the coverage rate for all students in lower secondary education (total of the three grade levels) doubled in the period from 2017 to 2020, as shown in Table 2.
| Year | Grade | Enrolment | Single users | Active users | Coverage rate | Active user rate | Take-up rate |
|---|---|---|---|---|---|---|---|
| 2017 | 7 | 42297 | 12365 | 6353 | 29 | 51 | 15 |
| 2017 | 8 | 39817 | 8597 | 3253 | 22 | 38 | 8 |
| 2017 | 9 | 40978 | 6300 | 2167 | 15 | 34 | 5 |
| 2017 | Total | 123092 | 27262 | 11773 | 22 | 43 | 10 |
| 2018 | 7 | 40504 | 11467 | 5574 | 28 | 49 | 14 |
| 2018 | 8 | 39667 | 10642 | 4370 | 27 | 41 | 11 |
| 2018 | 9 | 43155 | 6729 | 2186 | 16 | 32 | 5 |
| 2018 | Total | 123326 | 28838 | 12130 | 23 | 42 | 10 |
| 2019 | 7 | 38915 | 15732 | 8315 | 40 | 53 | 21 |
| 2019 | 8 | 37379 | 11056 | 4245 | 30 | 38 | 11 |
| 2019 | 9 | 42098 | 8488 | 2771 | 20 | 33 | 7 |
| 2019 | Total | 118392 | 35276 | 15331 | 30 | 43 | 13 |
| 2020 | 7 | 37502 | 21277 | 10603 | 57 | 50 | 28 |
| 2020 | 8 | 36324 | 18063 | 7361 | 50 | 41 | 20 |
| 2020 | 9 | 38942 | 15771 | 4546 | 40 | 29 | 12 |
| 2020 | Total | 112678 | 55111 | 22510 | 49 | 41 | 20 |
| Source: Authors’ work based on the CEIBAL database. | |||||||
The active user rate exhibits a similar trend to the coverage rate, decreasing as grade levels progress for each year. However, the active user rate of all students in lower secondary education in the period 2017-2020 remained practically constant at around 42%, with a one percentage point fluctuation.
Likewise, when examining the take-up rates of all students, a 30% increase is observed over a three-year period in the pre-pandemic period from 2017 to 2019. However, in 2020, there was a significant increase of 54%, driven by the impact of the COVID-19 pandemic.
Are there statistically significant differences in the use of PAM based on gender, institution size, region, year, and student grade level?
In addition to the descriptive approach, our analysis sought to determine whether there were significant differences in the average number of days of access to the PAM platform, activities and series completed, and stars obtained by students, according to socio-demographic factors such as gender, region of the school attended, grade level, and school size.
After confirming the normal distribution of the variables using the Kolmogorov-Smirnov test, Student’s t-test was employed for the gender and region variables, and the ANOVA test for the grade level and school size variables, to evaluate the likelihood of the differences in means between the observed groups occurring by chance.
Table 3 shows the mean values of our analysis, tested for significance. The procedure used associates each of the four socio-demographic factors under consideration (independent variables) to the four dependent variables included in the model.
| Gender | Region | Grade level | School size | |||||||||||
|---|---|---|---|---|---|---|---|---|---|---|---|---|---|---|
| F | M | Monte-video | Rest of Uruguay | 7th | 8th | 9th | S | M | L | |||||
| Login days | 6.02 | 5.63 | * | 5.35 | 5.95 | * | 6.79 | 5.22 | 4.97 | ** | 6.73 | 6.01 | 4.36 | ** |
| Completed activities | 178.84 | 185.51 | * | 139.33 | 194.41 | * | 235.00 | 160.00 | 116.00 | ** | 349.60 | 182.31 | 116.33 | ** |
| Completed series | 17.50 | 20.24 | * | 11.62 | 21.23 | * | 23.19 | 17.99 | 12.55 | ** | 62.21 | 15.11 | 9.70 | ** |
| Stars | 4.54 | 4.90 | * | 2.14 | 5.58 | * | 6.93 | 3.54 | 2.54 | ** | 14.27 | 2.90 | 1.92 | ** |
| Notes: * Student's t-statistic was analyzed. Significance level: p < .05. ** The one-way ANOVA statistic was analyzed for categorical variables with three levels. Significance level: p < .05 |
||||||||||||||
The statistical testing showed that gender had a favorable impact on the number of login days, with female students logging into the platform the most. Gender-related significant differences placed the mean scores of female students above those of male students for login days (female x̄ = 6.02, p< .001, and male x̄ = 5.63, p < .001). Similarly, statistically significant differences were found for the variables of completed activities, completed series, and stars, with averages in favor of male students. This leads to the conclusion that male students are more strongly engaged with the resources provided by the platform.
Parametric tests involving the region variable exhibited significant differences in favor of the rest of Uruguay (that is, outside the capital Montevideo). There, students exhibited higher login rates (Rest of Uruguay x̄ = 5.95, p < .001, Montevideo x̄ = 5.35, p < .001). Subsequent sections of this article will discuss this variable in more detail by exploring the differences between departments across the country.
Moreover, the significance test conducted made it possible to determine that school grade level has a positive influence on the number of login days, with seventh graders having the highest average number of logins. The results indicate that seventh-grade students accessed PAM more frequently than the rest of the students in the other grades (7th grade x̄ = 6.79, p < .001, 8th grade x̄ = 5.22, p < .001, and 9th grade x̄ = 4.92, p < .001).
On the other hand, statistically significant differences were found for the variables “completed activities,” “completed series,” and “stars.” Specifically, seventh-grade students outperform their counterparts in eighth and ninth grades and the most significant difference was observed in the number of stars earned by students in this grade level. Their average (x̄ = 6.93) was nearly twice the number earned by eighth-grade students (x̄ = 3.54) and almost three times the average of ninth-grade students (x̄ = 2.54).
Additionally, Table 3 presents the statistical test values for the school size variable and shows significant differences favoring smaller schools, in relation to the four variables that were proposed for the analysis. In small schools, the use of technologies was more frequent than in larger schools (small x̄ = 6.73, medium x̄ = 6.01, and large x̄ = 4.36). This means that the gamified reward system (“stars”), which aims to enhance student motivation and desire for self-improvement, shows a significantly higher average in small schools than in medium and large schools.
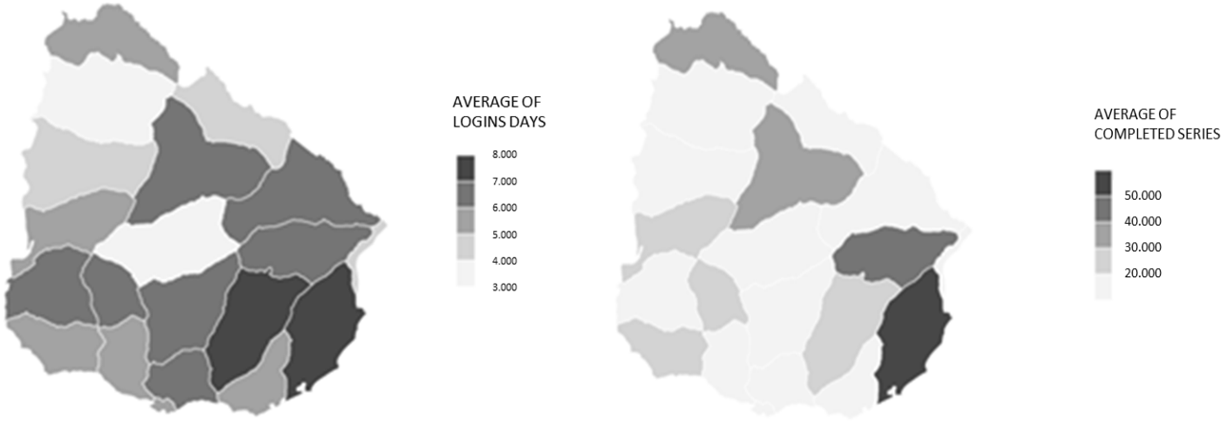
A study of variations in access based on the country’s regions reveals that departments located in the northwest of Uruguay exhibited the lowest average number of platform login days. In the eastern region, Rocha and Lavalleja had an average of almost eight login days, while in Cerro Largo and Treinta y Tres, the average was seven login days. The national average was close to six days.
Likewise, we also examined the regions in which students interacted with the platform the most. Substantial variations were observed between the national average (19 completed series) and the departments with the highest completion averages, such as Rocha (74 series) and Treinta y Tres (47 series). Durazno, on the other hand, has the lowest average value, with only 6 series completed. These findings are depicted in the heatmaps in Figure 1.
The variations in the PAM reward system show favorable outcomes for Tacuarembó and Treinta y Tres, with average values of approximately 24 and 19 stars, respectively, which greatly surpass the national average of almost 5 stars. Conversely, Durazno, with an average of one star, is the department with the lowest average number of rewards on the platform. The heatmaps in Figure 2 provide a visual representation of these findings.
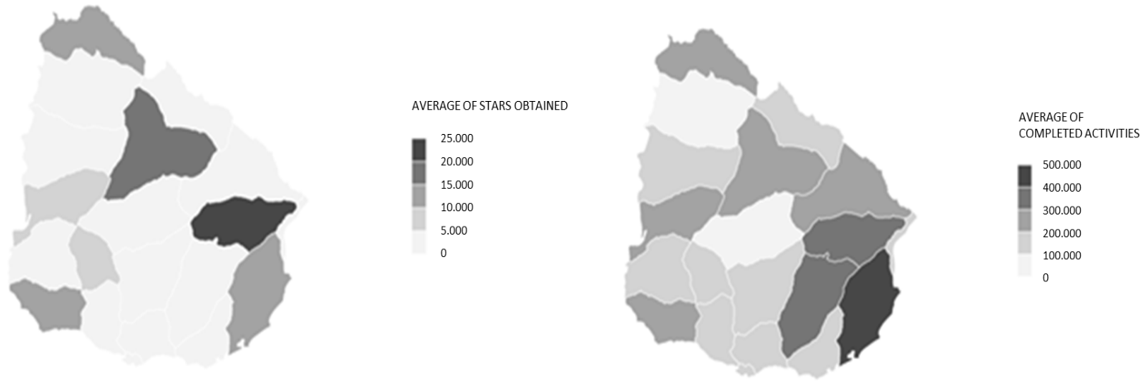
The departments situated in the east of the country exhibit the highest average values in terms of both student interactions with the platform and the number of stars earned.
The statistical analysis and subsequent hypothesis testing of the average number of completed series, which serves as an indicator of student interaction with PAM, revealed that male students exhibited higher engagement than female students in this variable (p < .001) (Male x̄ = 20.24 and Female x̄ = 17.58). Additionally, the remaining causal variables considered account for the variations in this proxy measure of platform effectiveness. Indeed, the evidence shows that students from the rest of Uruguay completed more PAM series than those from Montevideo (p < .001) (Rest of Uruguay x̄ = 21.23 and Montevideo x̄ = 11.62), as did students enrolled in seventh grade, compared to higher grade levels (p < .001) (7th grade x̄ = 23.19, 8th grade x̄ = 17.99, and 9th grade x̄ = 12.54). Furthermore, small schools exhibited significantly better outcomes than other larger schools (p < .001) (small x̄ = 62.21, medium x̄ = 15.11, and large x̄ = 9.70).
In line with the above analyses, a recurrent pattern of behavior emerges when looking at the average number of activities completed by students on the platform. There are significant differences in terms of gender, with male students having completed more activities than female students (p < .001) (male x̄ = 185.51 and female x̄ = 174.84). Location also plays a role, as evidenced by a higher frequency of completed activities observed in the rest of Uruguay (p < .001) (x̄ = 194.41), compared to Montevideo (x̄ = 139.33). Confirming the results observed in the other interaction variables, seventh-grade students (p < .001) (7th grade: x̄ = 235, 8th grade: x̄ = 160, and 9th grade: x̄ = 116) and students from small schools (small: x̄ = 349.50, medium: x̄ = 182, and large: x̄ = 116.33) exhibited a significantly higher frequency of platform use.
The use of stars by teachers is a strong indicator of how the reward system envisaged by PAM provides information about the level of student interaction with technology. Once again, the findings indicate that male students outperformed female students in terms of earning stars (p < .001) (male x̄ = 4.90 and female x̄ = 4.54) and that students from outside the capital, seventh-grade students, and those attending small schools exhibited a significantly higher level of interaction (all at p < .001; rest of Uruguay: x̄ = 5.58, Montevideo: x̄ = 2.14; 7th grade: x̄ = 6.93, 8th grade: x̄ = 3.54, and 9th grade: x̄ = 2.54; small: x̄ = 14.27, medium: x̄ = 2.90, and large: x̄ = 1.92).
IV. Discussion
The results of the exploratory study of the variables relating to student access to and interaction with the Bettermarks platform in Uruguay, spanning both pre-pandemic and pandemic years, have enhanced our understanding and enabled us to address the specific objectives that guided our research.
Firstly, concerning the platform access variables, we found evidence indicating an increase in the number of days students accessed PAM in 2020, compared to the three years preceding the pandemic. This finding aligns with those of national studies (Administración Nacional de Educación Pública [ANEP], 2021; INEEd, 2022) that collected data on access to other educational platforms such as CREA (a general platform that provides resources in a virtual classroom format for all teachers, regardless of content), which witnessed up to a fivefold increase in student access during 2020. Additionally, these findings validate the results of international studies that highlight the impact of utilizing platforms for teaching mathematics during COVID-19 quarantine and lockdown periods across the region and in Europe (Spitzer & Musslick, 2021).
The big data analysis and subsequent knowledge discovery from the patterns of use recorded in the CEIBAL databases confirmed a slight increase in take-up of PAM during the specified period of time, but low overall coverage. This finding aligns with the conclusions drawn from a recently published study by CEIBAL and UNICEF (2023), which, in 2022, found a low frequency of PAM use, with a mean value between one and two days per student per year. Similarly, the take-up of this platform was very low.
Moreover, the results also revealed high heterogeneity in access to PAM, as well as the impact of the social factors considered. It was found that the frequency of individual students’ access to PAM was higher in 2020 than in previous years, and higher in seventh grade than in the rest of the grade levels. Additionally, on average, female students accessed PAM more frequently than male students, and students from the rest of Uruguay have higher access rates than those living in Montevideo.
A greater level of access is observed in the northwest region of Uruguay, where the highest averages of platform login days are seen. The departments of Rocha and Lavalleja have an average of close to eight login days, followed by Cerro Largo and Treinta y Tres in the east, with an average of seven login days. The national average is approximately six days.
The significant heterogeneity in student access to PAM supports the conclusions of previous studies conducted in the country. These studies have indicated the existence of gender-based disparities in use (ANEP, 2021; INEEd, 2022), as well as the impact of structural factors such as the geographical location of students.
Secondly, concerning student interaction variables in the analysis models, the findings reveal a positive association with respect to the region (the rest of the country shows higher use than the capital, Montevideo), grade level (twelve-year-old students enrolled in the seventh grade of compulsory lower secondary education make greater use of the platform, based on all the interaction variables), and school size (learners in institutions with fewer than 400 students are more likely to use the platform).
An important discovery in this study is the confirmation that gender plays a significant role in platform use, with male students consistently exhibiting greater use than female students across all three interaction variables (activities, series, and stars). These findings contradict previous research conducted in Uruguay, which found no significant gender-based differences in the impact of PAM use on mathematics learning in primary education (Perera & Aboal, 2018), as well as international reports (Spitzer & Musslick, 2021).
In summary, one key finding of this study is the existence of independent effects regarding the gaps in access to, interaction with, and use of technology in the mathematics classroom, based on the variables considered, which pertain to the context in which this technology is used.
The heterogeneous patterns of use observed in the Bettermarks platform (PAM in Uruguay) are most likely the result of significant disparities in access to digital resources. Despite the country’s significant progress in bridging this gap, according to INEEd (2022), 30% of students still do not have access to digital educational resources. Additional explanatory factors not considered in this study should also be examined, such as how schools and teachers use digital educational technologies and platforms (Hinostroza, 2017).
In light of the results, there are at least three clear challenges for achieving greater effectiveness in teaching and learning mathematics. Firstly, it is necessary to ensure universal, consistent, and equitable access to the internet inside and outside school settings (Elena-Bucea et al., 2021; INEEd, 2022). Secondly, it is important to understand to what extent teachers make effective use of reports of use and access analytics provided by digital platforms to tailor their teaching strategies, for which new studies using a qualitative approach should be encouraged.
Lastly, one pending challenge would be to ensure that education systems promote institutional strategies and educational policies addressing the digital inequalities in access to knowledge. While these inequalities existed prior to the pandemic (Dewan et al., 2010), they have worsened since then, widening the divide between connected, partially connected, and disconnected students in their ability to benefit from the potential offered by online digital resources and learning platforms in times of COVID-19 lockdowns (Rivas, 2021).
V. Conclusions
The use of digital platforms in mathematics education holds immense potential for fostering inclusivity and enhancing learning. In Uruguay, notable progress has been made in educational policies aimed at providing universal access to digital educational resources. A relevant case is the incorporation of the Bettermarks platform for teaching mathematics, primarily used in lower secondary education.
In Uruguay, CEIBAL has an open data policy that enables an analysis of the influence of several factors on the use of the digital platform in the Uruguayan education system. This study analyzed a substantial dataset encompassing the main actions performed by students on the platform between 2017 and 2020. Over the course of the study period, there was a progressive rise in both access to the Bettermarks platform and the activities carried out by students.
This study tested multiple hypotheses to explain the heterogeneities in student access and interaction patterns. Significant statistical differences were identified in terms of coverage and activities performed by students, based on factors such as year, gender, region, grade, and school size. An analysis by gender showed that female students had higher access rates, while male students exhibited stronger rates of interaction. Moreover, georeferenced data were employed to show higher rates of use in the rest of Uruguay than in the capital city, Montevideo.
Our analysis provided insights into the changes in platform use during the peak of the COVID-19 pandemic. Absolute coverage was higher during 2020; however, when comparing relative activity rates between years, no significant differences were found.
The findings demonstrate the long-term impact of a public policy aimed at achieving universal access to digital educational resources. Nonetheless, there remains the challenge of moving beyond basic measurements of access and coverage and exploring, in greater detail, how students and teachers use these platforms effectively.
Writing review: Joshua Parker
Contribution of each author
Eduardo Rodríguez Zidán: conceptualization, data curation (50%), formal analysis (40%), methodology (35%), writing original draft (40%).
Gustavo Bentancor Biagas: data curation (50%), formal analysis (30%), methodology (35%), writing original draft (30%).
Martin Solari: formal analysis (30%), methodology (30%), writing original draft (30%).
Declaration of no conflict of interest
The authors declare no conflict of interest.
Source of funding
Fondo Sectorial de Educación, Fundación CEIBAL and Agencia Nacional de Investigación e Innovación (ANII) – Uruguay (FSED_2_2020_1_163598)
References
Administración Nacional de Educación Pública (ANEP). (2021). Rendición de Cuentas 2020. Educación en tiempos de pandemia, acción 2020 (Tomo 5) [Accountability 2020. Education in times of pandemic (Vol. 5)]. https://www.anep.edu.uy/sites/default/files/images/Archivos/presupuestos-rendicion-balances/rc-2020en2021/TOMO%205%202021%20v2%20WEB.pdf
Area-Moreira, M., Hernández-Rivero, V., & Sosa-Alonso, J. J. (2016). Models of educational integration of ICTs in the classroom. Comunicar, 24(47), 79–87. https://doi.org/10.3916/C47-2016-08
Ball, L., Drijvers, P., Ladel, S., Siller, H., Tabach, M., & Vale, C. (2018). Uses of technology in primary and secondary mathematics education. Springer. https://link.springer.com/content/pdf/10.1007/978-3-319-76575-4.pdf
CEIBAL, & UNICEF. (2023). Puentes digitales para la equidad educativa. Hallazgos, resultados y aprendizajes de la iniciativa [Digital bridges for educational equity. Findings, results, and lessons learned from the initiative]. https://ceibal.edu.uy/wp-content/uploads/2023/03/Informe-Puentes-digitales-para-la-equidad-educativa.pdf
CEIBAL. (2022). Observatorio Ceibal [Ceibal Observatory]. https://observatorio.ceibal.edu.uy/
Chiu, T., & Churchill, D. (2015). Exploring the characteristics of an optimal design of digital materials for concept learning in mathematics: Multimedia learning and variation theory. Computers & Education, 82, 280–291. https://doi.org/10.1016/j.compedu.2014.12.001
Cobo, C., & Montaldo, M. (2018, November). Plan Ceibal in Uruguay: How do you educate in learning to decode the unknown? UNESCO. https://unesdoc.unesco.org/ark:/48223/pf0000265994
Cullen, C. J., Hertel, J. T., & Nickels, M. (2020). The roles of technology in mathematics education. The Educational Forum 84(2), 166-178. https://doi.org/10.1080/00131725.2020.1698683
Dewan, S., Ganley, D., & Kraemer, K. L. (2010). Complementarities in the diffusion of personal computers and the internet: Implications for the global digital divide. Information Systems Research, 21(4), 925–940.
Díaz, C., Dodel, M., & Menese, P. (2022). Can one laptop per child reduce digital inequalities? ICT household access patterns under Plan Ceibal. Telecommunications Policy, 46(9), 102406. https://doi.org/10.1016/J.TELPOL.2022.102406
Drijvers, P., Thurm, D., Vandervieren, E., Klinger, M., Moons, F., van der Ree, H., Mol, A., Barzel, B., & Doorman, M. (2021). Distance mathematics teaching in Flanders, Germany, and the Netherlands during COVID-19 lockdown. Educational Studies in Mathematics, 108, 35–64. https://doi.org/10.1007/s10649-021-10094-5
ECLAC. (2020). Universalizar el acceso a las tecnologías digitales para enfrentar los efectos del COVID-19 (Informe Especial No. 7) [Universalizing access to digital technologies to address the consequences of COVID-19 (Special Report No. 7)].
Elena-Bucea, A., Cruz-Jesus, F., Oliveira, T., & Coelho, P. S. (2021). Assessing the role of age, education, gender and income on the digital divide: Evidence for the European Union. Information Systems Frontiers, 23, 1007–1021. https://doi.org/10.1007/S10796-020-10012-9
Fraillon, J., Ainley, J., Schulz, W., Duckworth, D., & Friedman, T. (2019). IEA International Computer and Information Literacy Study 2018 assessment framework. https://doi.org/10.1007/978-3-030-19389-8
Hillmayr, D., Ziernwald, L., Reinhold, F., Hofer, S., & Reiss, K.M. (2020). The potential of digital tools to enhance mathematics and science learning in secondary schools: A context-specific meta-analysis. Computers & Education, 153. https://doi.org/10.1016/j.compedu.2020.103897
Hinostroza, E. (2017). TIC, educación y desarrollo social en América Latina y el Caribe [ICT, education, and social development in Latin America and the Caribbean]. UNESCO. Oficina Regional de Ciencias para América Latina y el Caribe. https://repositorio.minedu.gob.pe/handle/20.500.12799/5802
INEEd. (2022). Informe sobre el estado de la educación en Uruguay 2019-2020. Tomo 1 [Report on the state of education in Uruguay 2019-2020. Volume 1]. https://www.ineed.edu.uy/images/ieeuy/2019-2020/Informe-estado-educacion-Uruguay-2019-2020-Tomo1.pdf
Lugo, M. T., & Ithurburu, V. (2019). Políticas digitales en América Latina: tecnologías para fortalecer la educación de calidad [Digital policies in Latin America: Technologies to strengthen quality education]. Revista Iberoamericana de Educación, 79(1), 11–31. https://redined.educacion.gob.es/xmlui/handle/11162/185464
Mateu, M., Cobo, C., & Moravec, J. (2018). Plan Ceibal 2020: Future scenarios for technology and education—the case of the Uruguayan public education system. European Journal of Futures Research, 6(1), 1–12. https://doi.org/10.1186/s40309-018-0134-z
Molina-Toro, J. F., Rendón-Mesa, P. A., & Villa-Ochoa, J. A. (2019). Research trends in digital technologies and modeling in mathematics education. Eurasia Journal of Mathematics, Science and Technology Education, 15(8). https://doi.org/10.29333/ejmste/108438
Moreira, A., & Zapata, M. (2021). Presentation. Revista de Educación a Distancia (RED), 21(65), 1–7.
Navarro L. A., Cuevas, O., & Martínez, J. (2017). Meta-análisis sobre educación vía TIC en México y América Latina [A meta-analysis of ICT-based education in Mexico and Latin America]. Revista Electrónica de Investigación Educativa, 19(1), 10–20. https://doi.org/10.24320/REDIE.2017.19.1.1217
Olsher, S., & Thurm, D. (2021, July 19–22). The interplay between digital automatic-assessment and self-assessment. Proceedings of the 44th Conference of the International Group for the Psychology of Mathematics Education (Vol. 3, pp. 431-440). Khon Kaen, Thailand: PME.
Perera, M., & Aboal, D. (2018). The impact of a mathematics computer-assisted learning platform on students’ mathematics test scores. Centro de Investigaciones Económicas. https://hdl.handle.net/20.500.12381/415
Pittaluga, L., & Rivoir, A. L. (2012). One laptop per child and bridging the digital divide: The case of Plan CEIBAL in Uruguay. Research on ICT4D from Latin America, 8(4), 145-159. https://n9.cl/lgtey
Rakes, C. R., Ronau, R. N., Bush, S. B., Driskell, S. O., Niess, M. L., & Pugalee, D. K. (2020). Mathematics achievement and orientation: A systematic review and meta-analysis of education technology. Educational Research Review, 31, 100337. https://doi.org/10.1016/J.EDUREV.2020.100337
Ran, H., Kasli, M., & Secada, W. G. (2020). A meta-analysis on computer technology intervention effects on mathematics achievement for low-performing students in K-12 classrooms. Journal of Educational Computing Research, 59(1), 119-153. https://doi.org/10.1177/0735633120952063
Ripani, M. F., & Muñoz, M. (2020). Plan Ceibal 2020: Desafíos de innovación educativa en Uruguay [Plan Ceibal 2020: Challenges of educational innovation in Uruguay]. Fundación Ceibal. https://hdl.handle.net/20.500.12381/308
Rivas, A. (2021). La plataformización de la educación: un marco para definir las nuevas orientaciones de los sistemas educativos híbridos [The platformization of education: A framework to define the new orientations of hybrid education systems]. Unesco. https://unesdoc.unesco.org/ark:/48223/pf0000377733_spa
Rodriguez, E., & Grilli, J. (2019). El b-learning en los cursos semipresenciales y presenciales de la formación inicial de profesores de ciencia en Uruguay [B-learning in the blended and face-to-face courses of the initial training of science teachers in Uruguay]. Ciencia, Docencia y Tecnología, 30(59 nov-abr). https://doi.org/10.33255/3059/691
Siemens, G. (2013). Learning analytics: The emergence of a discipline. American Behavioral Scientist, 57(10), 1380–1400. https://doi.org/10.1177/0002764213498851
SoLAR. (2011). What is Learning Analytics? Society for Learning Analytics Research. https://www.solaresearch.org/about/what-is-learning-analytics/
Spitzer, M. W. H., & Moeller, K. (2022). Predicting fraction and algebra achievements online: A large-scale longitudinal study using data from an online learning environment. Journal of Computer Assisted Learning, 38(6), 1797-1806. https://doi.org/10.1111/jcal.12721
Spitzer, M. W. H., & Musslick, S. (2021). Academic performance of K-12 students in an online-learning environment for mathematics increased during the shutdown of schools in wake of the COVID-19 pandemic. PLoS ONE, 16(8), 1-16. https://doi.org/10.1371/journal.pone.0255629
Stapel, M., Zheng, Z., & Pinkwart, N. (2016, June 29–July 2). An ensemble method to predict student performance in an online math learning environment. Proceedings of the 9th International Conference on Educational Data Mining. Raleigh, NC, USA. https://eric.ed.gov/?id=ED592647
Stein, M. (2015, February). Online platforms for practising mathematics in German and English speaking countries – a systematic comparison. CERME 9 - Ninth Congress of the European Society for Research in Mathematics Education (pp. 2559–2565), Prague, Czech Republic. https://hal.science/hal-01289380
Suhirman, S., Herawan, T., Chiroma, H., & Mohamad Zain, J. (2014). Data mining for education decision support: A review. International Journal of Emerging Technologies in Learning, 9(6), 4–19. https://doi.org/10.3991/ijet.v9i6.3950
Thurm, D., & Barzel, B. (2022). Teaching mathematics with technology: A multidimensional analysis of teacher beliefs. Educational Studies in Mathematics, 109, 41–63. https://doi.org/10.1007/S10649-021-10072-X
Vaillant, D., Rodríguez, E., Bentancor, G., Téliz, F., Zorrilla, V., Buchelli, J. & Rozenwig, R. (2019). Claves para incorporar las herramientas y plataformas digitales en la enseñanza de la matemática en el ciclo básico: percepciones de docentes y caminos de mejora. Informe final Proyectos I + D [Key points for incorporating digital tools and platforms in teaching mathematics in the basic cycle: Teacher perceptions and paths for improvement. Final report, R&D projects]. Montevideo: Universidad ORT Uruguay. Instituto de Educación. https://rad.ort.edu.uy/handle/20.500.11968/4281
Vaillant, D., Rodríguez-Zidán, E., & Questa-Torterolo, M. (2022). Pandemic and teacher’s perceptions about emergency remote teaching: The Uruguayan case. Revista Electrónica Educare, 26(1), 1–21. https://doi.org/10.15359/REE.26-1.4
Villamizar, F., Martínez, A., Cuevas, C., & Espinosa-Castro, J. (2020). Mathematical modeling with digital technological tools for interpretation of contextual situations. VI International Conference Days of Applied Mathematics (VI ICDAM). Journal of Physics: Conference Series, 1514(12003). https://doi.org/10.1088/1742-6596/1514/1/012003