Predictive Model to Identify College Students with High Dropout Rates
 https://orcid.org/0000-0002-7169-7963
How to cite: Hoyos, J. K. and Daza, G. (2023). Predictive model to identify college students with high dropout rates. Revista Electrónica de Investigación Educativa, 25, e13, 1-10. https://doi.org/10.24320/redie.2023.25.e13.5398

Abstract
Decreasing student attrition rates is one of the main objectives of most higher education institutions. However, to achieve this goal, universities need to accurately identify and focus their efforts on students most likely to quit their studies before they graduate. This has given rise to a need to implement forecasting models to predict which students will eventually drop out. In this paper, we present an early warning system to automatically identify first-semester students at high risk of dropping out. The system is based on a machine learning model trained from historical data on first-semester students. The results show that the system can predict “at-risk” students with a sensitivity of 61.97%, which allows early intervention for those students, thereby reducing the student attrition rate.
Keywords: dropping out, college students, forecasting, regression analysis
I. Introduction
One of the biggest challenges facing higher education institutions (HEIs) in most education systems worldwide is dropping out. Dropout is a complex phenomenon in higher education that cannot be easily defined (Tinto, 1982). One of the earliest dropout models defined it as the failure of a student enrolled at a particular university in the spring to enroll in that same university the next fall semester (Bean, 1985). According to Tinto (1982), dropout must be defined from different points of view. From an individual standpoint, dropping out refers to the failure to complete a given course of action or attain the desired objective that led a student to enroll in a particular higher education institution. University dropout is also defined as the premature abandonment of a study program due to factors arising within the educational system or relating to society, family, and environment, considering sufficient time to rule out the possibility of student reincorporation (Himmel, 2002). However, in practice, most universities define dropping out as abandoning a degree without graduating, provided that the student does not re-enroll during the next two semesters in the same degree course.
According to the report “Education at a Glance”, the average dropout rate in HEIs reaches 31% among OECD countries. The countries with the highest dropout rates are Hungary, New Zealand, and the United States, with New Zealand reaching 46%. Meanwhile, the lowest dropout rates are found in Japan, Germany, France, and Belgium. In Latin America, according to a bulletin by the Higher Education Observatory (ODES, 2017), attrition ranges between 40% and 75%. According to a study published by the World Bank (Ferreyra et al., 2017), on average 50% of Latin American students graduate on time, and the remaining 50% either drop out of the system or continue studying. Bolivia and Colombia have the highest dropout rates in Latin America. Specifically, in Colombia around 37% of students who enroll in a university program drop out without finishing their degree (Urzúa, 2017). Moreover, about 36% of students who drop out in Colombia do so at the end of the first year, making early dropout a critical problem in the Colombian education system.
According to the System for the Prevention and Analysis of Dropout in HEIs (SPADIES, 2016), the causes of dropout in higher education in Colombia are classified into four major categories: i) Individual: starting age of the students, monetary and time costs of studying in another city, unfulfilled expectations, pregnancy, etc.; ii) Academic: Lack of preparation from secondary education in general skills, insufficient professional and vocational guidance before college admission, and low academic performance, among other causes; iii) Socioeconomic: Low social class, low family income and parental unemployment, financial self-reliance, etc.; and iv) Institutional: lack of financial support from the institution for tuition and maintenance, instability in the academic rhythm in public universities, etc. Some other common factors have recently been identified as causes of college dropout, such as depression, anxiety, and weak family structure (Daley, 2010). Other studies have suggested that a proportion of college attrition may result from drug use (Patrick et al., 2016). The study showed that students who used cigarettes, marijuana, and other illicit drugs in high school were more likely to drop out of college.
The advantages of improving student retention are countless. In Latin America, education has the main purpose of reducing inequality and the gap between social classes. Therefore, ensuring that students complete their degrees is to provide them a higher chance of securing an enhanced standard of living and a better career (Thomas, 2002). Tertiary education for the most vulnerable population contributes fundamentally to equalizing opportunities to access the most highly desired positions on the social ladder, triggering processes of upward social mobility. The lack of educational development of the most vulnerable classes, resulting from a scarcity of development opportunities, is a factor in the increase in violence and insecurity. Dropping out represents a major problem not only for students themselves but also for universities and governments, due to the waste of resources invested in students who do not finish their studies. Consequently, reducing student attrition would help to ensure state resources are used more effectively. Additionally, if the student dropout rate is low, a university is more likely to achieve a higher ranking, thus securing more government funds and gaining an easier path to program accreditations (Ameri et al., 2016). Accordingly, universities are increasingly implementing strategies to decrease student attrition. These require adequate planning for interventions and a full knowledge of the causes behind the student attrition problem.
Latin American governments have developed methodologies to measure and study dropout. In particular, the Colombian Ministry of National Education has set up the SPADIES platform, which collects socioeconomic and academic information on students from different HEIs and makes it possible to establish links between data on dropout. This tool enables observation of students according to indicators of risk of abandonment. However, beyond merely investigating the causes of dropout, action should be taken for better understanding and intervention by monitoring, recording, and analyzing risk factors, and in particular, by identifying students at increased risk of abandonment. Universities, for their part, have implemented many strategies at students’ disposal to encourage them to stay in the HEI. These strategies include monitoring, tutoring, advising, and offering workshops and courses that support and promote students’ academic success by addressing their particular needs. For instance, Universidad Tecnológica de Pereira (UTP) in Colombia has deployed the Integral Support Program (Programa de Acompañamiento Integral, PAI), which is an institutional strategy aimed at tackling the issues of students dropping out or failing to complete their degree on time through multiple institutional efforts to respond to the biopsychosocial, academic, economic and policy needs of students. However, the success of these personalized support programs depends on the universities’ ability to properly recognize and prioritize students who need assistance and support. Therefore, in order to address dropout and improve retention rates, universities need to focus their efforts on students most at risk of dropping out.
This backdrop clearly gives rise to a need to implement predictive models to identify students liable to drop out. In this sense, some explanatory models have been developed to help HEIs to detect dropout students (Ameri et al., 2016). Traditional pattern recognition methods have also been used to identify at-risk students (Lin et al., 2009), and recently, data mining and machine learning communities have given special attention to student dropout prediction (Lakkaraju et al., 2015; Pérez et al., 2018; Sandoval-Palis et al., 2020). Nonetheless, some authors agree that training prediction models for dropout students remains a tough task. In addition, despite several years of work, further research is needed to improve the methods employed to find patterns in student attrition. In this context, we have developed an early warning system able to monitor students at considerable risk of dropping out, which is integrated into the PAI of the UTP to bring help to at-risk students and encourage them to stay in the university. This system is based on processing historical data relating to individual, academic, and socioeconomic variables for first-year students from the UTP, with the goal of training a machine learning algorithm to recognize patterns in students with a high likelihood of dropping out.
II. Methods
Recently, the problem of classifying students at risk of dropping out of college has become relevant. In this context, data analytics and machine learning methods are particularly useful because of their ability to detect patterns in historical data sets that allow for predictions of future data. Machine learning is a branch of artificial intelligence dedicated to the study of methods to provide artificial agents with the ability to learn from examples. Machine learning methods can generate models of complex problems through specific instances, finding patterns of behavior. These methods, in turn, can generalize and/or adapt to new situations and predict new cases based on past experience. Most universities have information systems in which all students are registered and characterized, providing insight into exactly which students are dropping out. This is ideal for predicting students at risk of dropping out, and makes it possible to train algorithms based on the characteristics of first-semester students from previous years, find common patterns among them, and assess new students by means of these algorithms, enabling us to identify and calculate which students are most likely to drop out.
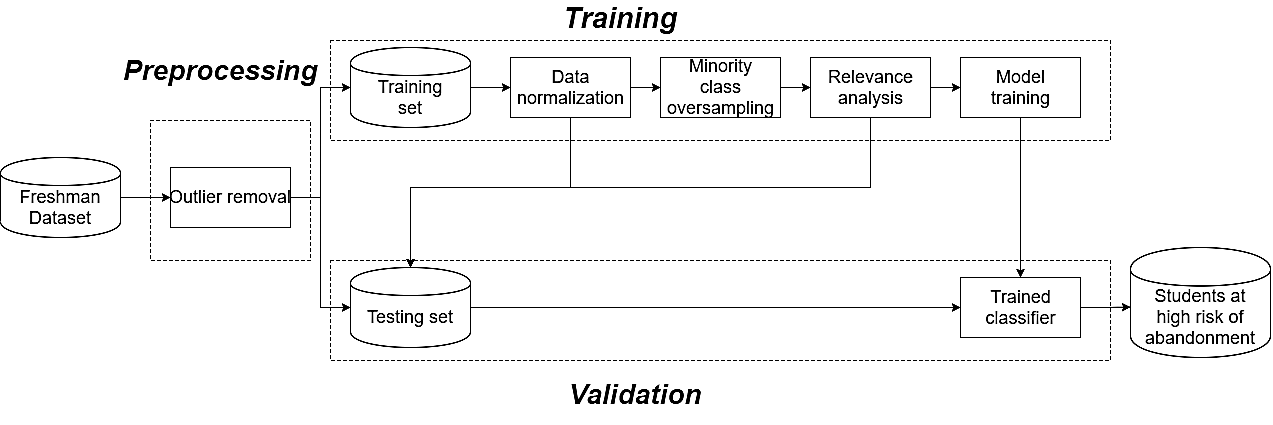
The machine learning methods are based on three fundamental stages: i) data preprocessing, ii) model training, and iii) system validation. For an early prediction of the students at risk of dropping out, we have combined different techniques as part of the three stages mentioned above, which are illustrated in the flow chart presented in Figure 1.
2.1 Database
In order to predict first-year students at high risk of dropping out, we created a database that compiles information relating to first-semester students from five different semesters (2017-1 to 2019-1). The dataset consists of 6617 participants (2845 female and 3772 male), with an average age of 20 years. The database is made up of a set of student features prior to their entry to the university such as age, sex, social stratum, state test score (Saber 11 score in Colombia), type of school (public or private), and cost of tuition paid. Additionally, the students take two kinds of tests when they start their degrees. Initially, the PAI test measures students’ level of academic, economic, family, and psychosocial risk, as well as their level of depression and anxiety, and individual learning style. In addition, they take the Alcohol, Smoking, and Substance Involvement Screening Test (ASSIST) developed for the World Health Organization (WHO). This test measures the level of consumption of different substances on a numerical scale from 0 to 39. Later, this feature matrix is complemented with inter-annual information on dropout from the university. This table reports students who remained in their degree program, changed programs, graduated, or dropped out of the university. Ultimately, this process yields a database of 6617 students and 26 features, and a vector of binary labels: not enrolled (for two consecutive semesters) and enrolled.
2.2 Data preprocessing
Data preprocessing is a crucial stage in machine learning applications to enhance the quality of data and recognize meaningful patterns in the data.
Data preprocessing refers to the techniques of “cleaning” the original data to make it suitable for training machine learning models. Data preprocessing includes data preparation, which includes integration, cleaning, normalization and transformation of data, and data reduction tasks such as feature selection, instance selection, discretization, etc. (García et al., 2015). Some preprocessing techniques used in this study, such as categorical variable encoding, outlier removal, oversampling, and feature selection, are explained below.
Categorical variable encoding. Most machine learning techniques cannot deal with categorical variables unless they are first encoded as numerical values. Categorical variables break down into two categories: nominal (no particular order) and ordinal (ordered). A nominal variable may be, for example, a color or a city, and an ordinal variable could be, for example, the level of satisfaction with a service, which could range from very dissatisfied to very satisfied. Before training a machine learning model, it is necessary to define how to encode the categorical variables. Dichotomous variables like sex can easily be encoded as a binary variable by making one of the two categories equal to one and the other equal to zero. Ordinal categorical variables can be assigned to numbers in their respective order, e.g. LOW = 1, MID = 2, and HIGH = 3. For nominal variables, it is impossible to employ the same procedure because there is no specific order for each category. For this reason, a well-known encoding technique known as one-hot encoding is used. This technique converts categorical variables into various new variables where 0 indicates the non-existence of a specific category while 1 indicates the presence of that variable.
Outlier detection. An outlier is an observation whose value differs from the general pattern of a sample, affecting the analysis of a given dataset. Outliers can have a range of distinct causes such as data entry errors, errors while designing the experiment, errors in the processing stage or just natural abnormalities in data. For classification and prediction purposes, the quality of data is essential, and there are several methods that allow us to detect and remove outliers from a dataset. In this research, we have employed a method based on decision trees called isolation forests (Hariri et al., 2019).
Minority class oversampling. Due to the nature of the event that we are trying to predict, it is common to find in our datasets many more students labeled as “enrolled” than “dropped out.” This phenomenon is known as the class imbalance problem. This issue is challenging to handle since most classifiers often expect evenly distributed training samples among classes. Without consideration of the imbalance problem, the classification algorithms can be overwhelmed by the majority class and ignore the minority one (Guo et al., 2008).
There are different alternatives to deal with the imbalanced data classification issue. One option, known as oversampling, augments the number of minority class samples to match the number of samples in each of the classes. Specifically, we employed a well-known method named the Synthetic Minority Oversampling Technique (SMOTE) (Chawla et al., 2002). The SMOTE algorithm creates synthetic data between samples of the minority class. To create a sample, this algorithm randomly selects one of the nearest neighbors to a specific sample, then computes the difference vector between the two samples, and this vector is then multiplied by a random number between 0 and 1. Finally, this value is added to the sample in consideration, creating a new sample.
Relevance analysis. The number of variables used to measure the observations is known as the dimension of the feature space. One problem with many data sets is that, in many cases, not all the measured variables are important for understanding the phenomenon under analysis (Fodor, 2002), that is, some variables are relevant for pattern recognition but others are not. Additionally, there could be redundant variables providing the same information to the model, and some of these may therefore be discarded. One common way to identify relevant features is to employ feature selection methodologies. Feature selection is the process by which researchers select the most relevant features that contribute to predicting the phenomenon of interest.
Specifically, in this research, we implemented a methodology known as recursive feature elimination (RFE), which is a feature selection method that fits a model and removes the weakest feature (or features) until a specified number of features is reached (Chen & Jeong, 2007). Features are classified according to each feature’s importance, obtained from a relevance model. Then, RFE recursively removes one feature per cycle (the lowest ranked feature according to the relevance model). The optimal number of features to achieve the best result is determined through five-fold cross-validation.
2.3 Training the prediction model
Once the data has been preprocessed, we can train a machine learning classifier to recognize patterns in data that allow us to predict students at high risk of dropping out. In this case we used the well-known logistic regressor (Hosmer et al., 2013), which maps the output of a linear regression model to probabilities between 0 and 1 through a logistic function defined as:
\[P\left( Y^\left(i \right)=1 \right)=\frac{1}{1+ exp\left(-\left(\beta_0 + \beta_1 x_1 \left( i \right) + ... + \beta_p x_p \left( i \right) \right) \right)}\]
where x represents each one of the features of the training data and y represents each one of the classes.
2.4 Model validation
To assess the performance of a classifier, some data must be reserved for testing the trained classifier. This process is known as cross-validation. This methodology is used to evaluate the performance of a classifier by training it on a subset of the data and then testing the algorithm on the remaining input data (Raschka, 2018). There are three main variants of cross-validation for classifiers, but in this research, we employ the holdout cross-validation technique. The holdout method divides the database into training and testing sets. The model is trained using the training samples, and then assessed by predicting the labels for the testing set that the model has never seen before.
Some metrics exist to measure the performance of a classifier. Most classification assessments are carried out by measuring the overall classification error rate; however, when handling imbalanced data, classification accuracy is not sufficient. As suggested by He and Ma (2013), class-specific metrics, such as sensitivity and specificity, and a combination of both, like the geometric mean, provide a more complete assessment of imbalanced learning. Therefore, in this research we use these three metrics. We quantify the effectiveness of the classification system to detect students who will drop out (sensitivity) and to correctly classify students not at risk of quitting university (specificity), and we also calculate the geometric mean (G-mean), which is defined as \(g=\sqrt{sensitivity.specificity}\).
III. Experiments and results
3.1 Experimental framework
All the experiments carried out in this research were performed using the statistical program Python 3. The experiment was set up as follows. First, the dataset was divided into training, testing, and validation sets. To validate the system, 20% of the data was randomly chosen and kept aside to prove the performance of the final classifier. The remaining 80% of the data was split according to the semester in which the data was collected. Finally, we trained the classifier from the data of all semesters except one, which was used as a testing set.
Before the model was trained, the variables were normalized using the Z-score method to ensure that all variables were in a similar range. Then SMOTE was implemented to balance the dataset, which was highly imbalanced. As explained above, SMOTE creates synthetic samples of the class with the lowest number of samples – in this case, the dropout class.
Then, the system goes through a stage of feature selection using RFE. This allows us to determine the most relevant features that characterize freshman students who drop out. As previously outlined, we started with an initial set of 26 features, and for each period tested, the RFE method selected an appropriate number of relevant features that led to the best performance. Yet these features are not the same in each iteration. Therefore, to train the final classifier, we chose those features that were selected in at least three of the five periods validated. Thus, the final set of features was reduced to 20. These are shown in Table 1.
Finally, a logistic regressor was trained from the resulting characteristics. Once the classifier was trained, it was tested on the validation data. Then, the sensitivity, specificity, and geometric mean (G-mean) of the prediction were calculated.
| Feature | Select by RFE | Feature | Select by RFE |
|---|---|---|---|
| Age | No | ASSIST alcohol value | Yes |
| Sex | Yes | ASSIST cannabis value | Yes |
| Stratum | Yes | ASSIST cocaine value | Yes |
| Type of school | Yes | ASSIST amphetamine value | Yes |
| State test score | Yes | ASSIST inhalants value | Yes |
| Tuition cost | No | ASSIST sedatives value | Yes |
| Academic risk | Yes | ASSIST hallucinogens value | No |
| Family risk | Yes | ASSIST opioids value | Yes |
| Economic risk | No | ASSIST other drugs value | Yes |
| Psychosocial risk | No | Learning style: Converger | Yes |
| Depression level | Yes | Learning style: Diverger | Yes |
| Anxiety level | No | Learning style: Assimilator | Yes |
| ASSIST tobacco value | Yes | Learning style: Accommodator | Yes |
Finally, as the objective is to assign predictive risks, the probabilities or “scores” of the classifier are taken for each test sample and classified into five ranges, as follows: i) 0 - 0.2, low risk; ii) 0.2 - 0.4, medium-low risk; iii) 0.4 - 0.6, medium risk; iv) 0.6 - 0.8, medium-high risk; v) 0.8 – 1, high risk. Finally, the performance of the classifier is measured in these end ranges, which are of greatest interest. For the sake of clarity, high-risk accuracy refers to the percentage of students labeled as high-risk who did indeed drop out, and, conversely, low-risk accuracy is the proportion of students who remained enrolled and who were successfully classified by the system as such.
3.2 Results and discussion
The obtained results are shown in Table 2. The testing periods are presented by row, and the evaluation metrics are given in the columns. The main purpose of these metrics is to provide clarity about how accurate the trained classifier is. The closer these metrics come to 1, the more effective the classifier is.
| Testing period | G-mean | Sensitivity | Specificity | High-risk accuracy | Low-risk accuracy |
|---|---|---|---|---|---|
| 2017-1 | 0.5706 | 0.7225 | 0.4507 | 0.8 | 0.8333 |
| 2017-2 | 0.5360 | 0.7105 | 0.4043 | 0.375 | 0.75 |
| 2017-1 | 0.5706 | 0.7225 | 0.4507 | 0.8 | 0.8333 |
| 2018-1 | 0.5808 | 0.5681 | 0.5938 | 0.625 | 0.9622 |
| 2019-1 | 0.6258 | 0.5164 | 0.7584 | 0.3382 | 0.9426 |
| Validation test | 0.6563 | 0.6197 | 0.6951 | 0.6226 | 0.9450x |
Since the aim of this prediction model is to detect students at high risk of dropping out, we focus on the metrics of high-risk accuracy and low-risk accuracy. In some periods the model achieves outstanding high-risk accuracy, as in the 2017-1 and 2018-2 periods. However, in 2017-2 and 2019-1, the system performs more poorly. Additionally, in the validation test, the system achieves a high-risk accuracy of 0.6226. Nonetheless, these results are not as problematic as they may seem, because this means that the system is labeling some students as at high risk of dropout, but ultimately they continue studying. This can often happen because the system is trained from some features measured before the start of their first semester, and does not consider the university’s social intervention program, the Integral Support Program (PAI), which provides economic, academic, and biopsychosocial support. Since this assistance is focused on the student population facing the greatest risk and greatest difficulties in college, the support received may encourage them to remain enrolled, yielding a poor high-risk accuracy in the system. By contrast, the system exhibits adequate low-risk accuracy in most cases, ranging from 75% to 96%, which means that low-risk predictions are fairly accurate. It is worth stressing that it is more burdensome to have a low low-risk accuracy than a low high-risk accuracy because a poor low-risk accuracy means that many dropout students are not being detected by the algorithm, and the system can ill afford not to detect students at high risk of quitting their studies.
There are also recent machine learning methodologies for early detection of students at risk of dropping out (Berens et al., 2018; González & Arismendi, 2018; Pérez et al., 2018), just one of which focuses on first-year students. Pérez et al. (2018) modeled a predictive system for retention of first-year students at Bernardo O’Higgins University, which obtained 86.4% accuracy for the student retention variable. Although this result seems quite high, it can be misleading, since the study did not consider the imbalance of the dataset. This may mean that all students in the dataset were classified as “retention students,” even those who actually dropped out. Our methodology instead focuses on this specific group of potential dropout students, since it is those students who require special attention from the university. Compared with the other approaches, the predictor variables used in each one of these studies vary from country to country, and even though some may be similar, each national education system – and, indeed, each individual university – may collect different information, making direct comparisons unfair. In fact, this methodology is, to the best of our knowledge, the first dropout prediction approach that includes the Alcohol, Smoking, and Substance Involvement Screening Test and learning styles as predictor variables.
The results obtained by our model match several studies that identify drug use as one potential cause of college dropout (Patrick et al., 2016), since the feature selection technique chose most of the ASSIST test variables as key variables for dropout prediction. The depression variable was also selected by the model, which corroborates some studies that have shown that depression is related to a lower grade point average and therefore dropout (Bruffaerts et al., 2018).
IV. Conclusions
This paper presents an early dropout prediction system to detect students at high risk of leaving college. This system is based on the processing and analysis of several variables influencing university dropout. The analysis focused on first-semester students, because they allow early identification of at-risk students by higher education institutions, and additionally, it is this group of students who are most likely to drop out of college. Specifically, we train a machine learning algorithm to recognize patterns in first-semester dropout students from previous years, enabling the system to learn to detect the characteristics of a student at high risk of dropping out. Thus, the system ties in with the Integral Support Program of the Universidad Tecnológica de Pereira, which is responsible for providing these students with economic and psychological support and responding to the biopsychosocial, academic, economic, and policy needs of high-risk students, to encourage them to stay in college. The results show that the system can discriminate between students at risk and not at risk of dropping out, establishing that at least 62.26% of students labeled as high-risk will indeed drop out. This will allow these students to receive prompt attention, thereby reducing the student attrition rate.
Referencias
Ameri, S., Fard, M. J., Chinnam, R. B., & Reddy, C. K. (2016). Survival analysis based framework for early prediction of student dropouts. In Proceedings of the 25th ACM International on Conference on Information and Knowledge Management (pp. 903-912). https://doi.org/10.1145/2983323.2983351
Bean, J. P. (1985). Interaction effects based on class level in an explanatory model of college student dropout syndrome. American Educational Research Journal, 22(1), 35-64. https://doi.org/10.3102/00028312022001035
Berens, J., Schneider, K., Görtz, S., Oster, S., & Burghoff, J. (2018). Early detection of students at risk: Predicting student dropouts using administrative student data and machine learning methods (Working paper No. 7259). Center for Economic Studies & Ifo Institute. http://dx.doi.org/10.2139/ssrn.3275433
Bruffaerts, R., Mortier, P., Kiekens, G., Auerbach, R. P., Cuijpers, P., Demyttenaere, K., Green, G., Nock, M., & Kessler, R. C. (2018). Mental health problems in college freshmen: Prevalence and academic functioning. Journal of Affective Disorders, 225, 97-103. https://doi.org/10.1016/j.jad.2017.07.044
Chawla, N. V., Bowyer, K. W., Hall, L. O., & Kegelmeyer, W. P. (2002). SMOTE: Synthetic Minority Over-Sampling Technique. The Journal of Artificial Intelligence Research, 16, 321-357. https://doi.org/10.1613/jair.953
Chen, X. W., & Jeong, J. C. (2007, December). Enhanced recursive feature elimination. In Sixth International Conference on Machine Learning and Applications (ICMLA) (pp. 429-435). IEEE.https://doi.org/10.1109/ICMLA.2007.35
Daley, F. (2010). Why college students drop out and what we do about it. College Quarterly, 13(3), 1-5. https://eric.ed.gov/?id=EJ930391
Ferreyra, M. M., Avitabile, C., Botero Álvarez, J., Haimovich Paz, F., & Urzúa, S. (2017). At a crossroads: Higher education in Latin America and the Caribbean. World Bank.
Fodor, I. K. (2002). A survey of dimension reduction techniques (Technical Report No. UCRL-ID-148494). Lawrence Livermore National Lab. https://www.osti.gov/biblio/15002155
García, S., Luengo, J., & Herrera, F. (2015). Feature selection. In Data preprocessing in data mining (pp. 163-193). Springer International Publishing. https://doi.org/10.1007/978-3-319-10247-4_7
González, F. I., & Arismendi, K. J. (2018). Deserción estudiantil en la educación superior técnico-profesional: explorando los factores que inciden en alumnos de primer año [Student dropout in technical and vocational higher education: Exploring factors that influence freshmen]. Revista de la Educación Superior, 47(188), 109-137. https://doi.org/10.36857/resu.2018.188.510
Guo, X., Yin, Y., Dong, C., Yang, G., & Zhou, G. (2008, October). On the class imbalance problem. In 2008 Fourth international conference on natural computation (Vol. 4, pp. 192-201). IEEE. https://doi.org/10.1109/ICNC.2008.871
Hariri, S., Kind, M. C., & Brunner, R. J. (2019). Extended isolation forest. IEEE Transactions on Knowledge and Data Engineering, 33(4), 1479-1489. https://doi.org/10.1109/TKDE.2019.2947676
He, H., & Ma, Y. (2013). Imbalanced learning: Foundations, algorithms, and applications. John Wiley & Sons.
Himmel, E. (2002). Modelo de análisis de la deserción estudiantil en la educación superior [Higher education student dropout analysis model]. Calidad en la Educación, (17), 91-108. http://dx.doi.org/10.31619/caledu.n17.409
Hosmer Jr, D. W., Lemeshow, S., & Sturdivant, R. X. (2013). Applied logistic regression (Vol. 398). John Wiley & Sons.
Lakkaraju, H., Aguiar, E., Shan, C., Miller, D., Bhanpuri, N., Ghani, R., & Addison, K. L. (2015, August). A machine learning framework to identify students at risk of adverse academic outcomes. In Proceedings of the 21th ACM SIGKDD International Conference on Knowledge Discovery and Data Mining (pp. 1909-1918), Sydney NSW Australia. https://doi.org/10.1145/2783258.2788620
Lin, J. J., Imbrie, P. K., & Reid, K. J. (2009. July). Student retention modelling: An evaluation of different methods and their impact on prediction results. Proceedings of the Research in Engineering Education Symposium (REES), Palm Cove, Australia. https://www.proceedings.com/content/023/023353webtoc.pdf
Observatorio de Educación Superior. (2017, July 1). Deserción en la educación superior [Dropout in higher education]. ODES Boletín (5). https://www.sapiencia.gov.co/wp-content/uploads/2017/11/5_JULIO_BOLETIN_ODES_DESERCION_EN_LA_EDUCACION_SUPERIOR.pdf
Patrick, M. E., Schulenberg, J. E., & O’Malley, P. M. (2016). High school substance use as a predictor of college attendance, completion, and dropout: A national multicohort longitudinal study. Youth & society, 48(3), 425-447. https://doi.org/10.1177/0044118X13508961
Pérez, A. M., Escobar, C. R., Toledo, M. R., Gutierrez, L. B., & Reyes, G. M. (2018). Prediction model of first-year student desertion at Universidad Bernardo O’ Higgins (UBO). Educação e Pesquisa, 44. https://doi.org/10.1590/S1678-4634201844172094
Raschka, S. (2018). Model evaluation, model selection, and algorithm selection in machine learning. arXiv Cornell University. http://arxiv.org/abs/1811.12808
Sandoval-Palis, I., Naranjo, D., Vidal, J., & Gilar-Corbi, R. (2020). Early dropout prediction model: A case study of university leveling course students. Sustainability, 12(22), 2-17. https://doi.org/10.3390/su12229314
Sistema para la Prevención de la Deserción en las Instituciones de Educación Superior-SPADIES. (2016). Reporte sobre deserción y graduación en educación superior año 2016 [Report on dropout and graduation in higher education, year 2016]. https://bit.ly/3K0RQmc
Thomas, L. (2002). Student retention in higher education: the role of institutional habitus. Journal of Education Policy, 17(4), 423-442. https://doi.org/10.1080/02680930210140257
Tinto, V. (1982). Defining dropout: A matter of perspective. New Directions for Institutional Research, (36), 3-15. https://doi.org/10.1002/ir.37019823603
Urzúa, S. (2017). The economic impact of higher education. In M. M. Ferreyra, C. Avitabile, J. Botero, F. Haimovich, & S. Urzúa (Eds.), At a crossroads: Higher education in Latin America and the Caribbean (pp. 115-148). World Bank. https://doi.org/10.1596/978-1-4648-1014-5_ch3