Revista Electrónica de Investigación Educativa
Vol. 3, No. 1, 2001
Differential Weighting of Items to Improve
University Admission Test Validity
Eduardo Backhoff Escudero
(2)
backhoff@uabc.edu.mx
Felipe Tirado Segura
(1)
ftirado@unam.mx
Norma Larrazolo Reyna
(2)
normal@uabc.mx
1
Facultad de Estudios Superiores Iztacala
Universidad Nacional Autónoma de México
Av. de los Barrios s/n
Col. Los Reyes Iztacala, 54090
Tlalnepantla, Estado de México, México
2
Instituto de Investigación y Desarrollo Educativo
Universidad Autónoma de Baja California
A.P. 453
C.P. 22830
Ensenada, Baja California, México
(Received: January 29, 2001;
accepted for publishing: February 21, 2001)
Abstract
This paper gives an evaluation of different ways to increase university admission test criterion-related validity, by differentially weighting test items. We compared four methods of weighting multiple-choice items of the Basic Skills and Knowledge Examination (EXHCOBA): (1) punishing incorrect responses by a constant factor, (2) weighting incorrect responses, considering the levels of error, (3) weighting correct responses, considering the item’s difficulty, based on the Classic Measurement Theory, and (4) weighting correct responses, considering the item’s difficulty, based on the Item Response Theory. Results show that none of these methods increased the instrument’s predictive validity, although they did improve its concurrent validity. It was concluded that it is appropriate to score the test by simply adding up correct responses.
Key words: Weighting of items, weighted scores, evaluation methods, predictive validity, admissions test.
Introduction
It is often said that a measurement tool is valid if it measures what it is supposed to measure. However, strictly speaking, one validates not a measuring instrument, but the specific use given to the scores or results (Cronbach, 1971).
For several decades, various methods have been sought to increase the validity of certain tests used for selection and certification of students. One of these consists in improving the conventional process of grading the test—which is restricted to adding up the number of correct answers—with another process more complex and more representative of the person’s performance. This can be achieved by giving different weights to (weighting) the components and questions that make up a test. This weighting can be performed according to different criteria such as: the importance of the subjects being evaluated, the difficulty of the questions, the kinds of errors made by those taking the test, etc.
After a review of the literature from 1982 to date, we find a variety of studies on “weighted scores”; these seek to find ways of improving the validity of the instruments used, particularly the predictive validity. We can classify these works as those that study the weighting of: (1) the results of two or more evaluations (2) the different sections of a test and (3) each of the questions that make up the instrument.
In the first case, we have studies on the admission, promotion and certification of students. For example, Talley and Mohr (1991) studied the effect of giving different weights to the levels of school grades for admission to universities. Nemecké (1994) and Talley and Mohr (1993) investigated a weighted system for promotion or graduation of students. Siegel (1991) and Bravin (1983) explored the differential weighting of course grades, depending on their level of difficulty.
The second type of study investigates the weighting of the components of an examination, test, or assessment. For example, Govindarajulu (1988) analyzes four methods for combining scores in the same test. Donnelly (1983) investigates the benefits of weighing the scores of the Medical College Admission Test, and Willis (1993) studies the weighting of variables to identify students with special needs.
The third type of study analyzes the weighting of test questions. Thus, Haladyna and Sympson (1988) develop a multiple-weighting method for domain-referenced tests. This method weights each item according to the average percentile of examinees who chose that option. The results show that this method of multiple weighting gives the highest reliability for the test, and the best domain-related validity. As for Razel and Eylon (1987), they validate various methods for grading the Raven’s Coloured Progressive Matrices Test. To do this, they compare the conventional way of grading the test with three multiple-weight scoring methods: (1) according to the theory of cognitive processing, (2) according to the opinion of experts, (3) and based on the answers the students selected. The concurrent validity of these four forms of scoring is compared, using other general-intelligence tests. The results show that the weighted score is preferable to the conventional, because it improves the validity and reliability of the test: an empirical weighting being the best method. Finally, Budescu (1979), using multiple regression analysis, differentially weights multiple-choice items, to maximize the predictive validity of a test. The results indicate that more complex scoring rules produce greater variance in the items and scores. However, there is no increase in the predictive validity of the test.
Although not all the studies support the idea that weighting improves the criterial validity of evaluation instruments, and there are researchers who, on principle, deny this possibility (Tristan and Vidal, 2000), there is a tendency to assume that improving the manner of scoring increases the predictive validity of the tests.
This hypothesis is based on the idea that our knowledge and skills are not expressed alternately and categorically (right answers and wrong ones), but instead, there are nuances or differences of degree, which can become very important. Our procedure is based, rather, on a calculation of opportunities, risks, benefits and costs; so that it is neither that simple, nor relevant, to identify our answers as simply “good” or “bad.” It can also be argued that the questions on a test of knowledge are not of equal difficulty; some are easier than others. As well, the difficulty of a question is not fixed, but is relative to the skills and knowledge of the person who is taking the test. These considerations also open the debate over the relevance of giving equal weight to all the questions.
However, it is not clear whether the weighting of scores improves the validity of a test, nor is it clear which is the best manner of weighting. Concerning that, the purpose of this study was to compare four methods for weighting multiple-choice questions for a higher-education entrance examination. These weighting methods are: (1) punish the wrong answers with a constant factor, (2) weight the punishment of wrong answers according to the “seriousness” of the error, (3) weight the right answers according to the item’s difficulty index p (Classical Theory of Measurement) and (4) weight the right answers according to the item’s difficulty index b (Item Response Theory).
Methodology
Instruments. The Basic Knowledge and Skills Examination (EXHCOBA) is used as an admissions test in several Mexican public universities. Its principal characteristic is that it evaluates the essential academic competencies of all the areas of knowledge learned from elementary school through high school, and which are considered necessary for success in university studies. Since the EXHCOBA has been described in detail in other publications (Backhoff y Tirado, 1992), in this section we will mention only its properties most important for the design of this study:
- The EXHCOBA consists of three sections: Basic Skills (60 questions), basic knowledge (70 questions), and basic knowledge of specialty (180 questions).
- All students answer the first two sections of the test, which includes a total of 130 questions, and only answer 60 questions from the third section, according to the field of knowledge they want to study. In this study, for practical reasons, we have analyzed only the results of the first 130 questions.
- The exam has five equivalent versions of each of the 310 items on the test. In this study we used only one (version 2).
- There are two test formats, one for pencil and paper, the other for computer. In this study we used the computerized version. A detailed description of the interface, and its equivalence with the pencil-and-paper format, is published by Backhoff, Ibarra and Rosas (1995).
Criterion variables. A methodological decision we had to make in this study was related to the criterion for assessing the degree to which the results of the EXHCOBA improve when using different scoring methods, weighted or unweighted. Following the directions of the literature on the admission test, we agreed that the related criteria were the average scores of the first university semester to determine the predictive validity, and the high school GPA for concurrent validity. Thus both the predictive and concurrent validity were obtained by correlating these scores with the EXHCOBA scores.
Population. In the summer of 1998, the EXHCOBA was applied to about 9,000 students who wanted to enter the Autonomous University of Baja California (UABC). Of these, there were selected 882 applicants who took Version 2 of this examination. Entering the university were 653 of those students, of which 301 young people enrolled in the summer semester of that year; the rest enrolled in the winter semester 1999. A year after the students took the test, the UABC Department of Scholastic Services was asked for the Cardex file that stores the record of courses for all students entering the university. Like the test-results file, this file was prepared to perform the statistical analyses for those students who entered the university in the summer of 1998. The preparation consisted of obtaining the high school grade point averages of all students, as well as averages of the grades obtained during the first semester of college. In this case, subject grades were alphanumeric. To calculate the averages, a score of zero was assigned to failed subjects (e.g. NA, no credit; SD, sin derecho [without the right1); and a score of ten to courses for which students obtained passing grades, with credit obtained.
Procedure. The steps followed to administer and score the test were the same as those the university defines for its admission process: (1) the student paid for and obtained a permit on which was indicated the date, place and time of his/her examination; (2) based on the student’s chosen field of study, the automated system presented one of the seven types of tests, according to the areas of knowledge in which the UABC groups its study programs; (3) the student took the test without any type of help (calculators, dictionaries, etc.) other than pencil and paper, and (4) the system automatically checked the answers and gave the student a written report on his/her performance. During this process, there was always present a qualified person who resolved any problems or queries about the computer version of the test.
As students finished taking the examination, the results were entered in a database. This was subsequently prepared to perform the relevant statistical analyses. The preparation consisted in transforming the students’ raw results into four different formats, after removing the cases with abnormal response patterns (e.g. empty records):
- Categorical format. Where correct answers have a value of 1; incorrect answers, a value of -0.25; and omissions, a value of 0.
- Format error gradient. To calculate this, the student group was divided into three subgroups, according to the number of correct answers they got on the test, thus forming a top third, a middle third, and a bottom third. To weight the grade, points were added to the total of the right answers according to the percentage of errors made by the upper third. For example, if 86% of the subjects in the upper group chose option “b”, which was wrong, all those who made this error (from the upper, middle and lower) got 0.86 additional compensatory points, with the premise that that option was not so wrong. If from the upper group only 3% chose the wrong option “c”, in that case there was added 0.03 points, considering that that answer was really bad or naive for the upper group. In the wrong choices that the members of the upper subgroup did not select, no compensatory point was awarded.
- Format of the index of difficulty (p values). In this analysis, we assume that not all the right answers must have the same weight in the grade, but rather, that answers are weighted by the degree of difficulty, with the result that the most difficult questions will give more points to the score than those that are easier. The graduation of weight was made equivalent to the inverse value of p (difficulty of the questions, in the Classical Theory of Measurement). For example, if a question was answered correctly by 96% of the students, then it was considered a very easy question, and the value of a right answer was 0.04. However, if the question was very difficult, and only 2% answered it correctly, then it was assigned a value of 0.98 points for each participant who answered it correctly. In this case, wrong answers always had a value of 0.
- Format of the index of difficulty (b values). Using the same reasoning outlined in the previous point, but now based on Item Response Theory (Muniz, 1997) and using the program Bilog (Mislevy and Bock, 1982) for the three-parameter model, indices of difficulty (b values) were calculated for each of the 130 items of the test used; incorrect responses had a value of 0.
Results
With the four databases developed, 11 correlations were made, using the statistical package SPSS (v. 9). Table I shows the results. Just for reference we show the correlations between high school marks and university grades (see last column). Here we see that the predictive validity of the high school average is 0.306; a relatively modest value as compared with international reports.
Table I. Correlations of the EXHCOBA scores,
using different weighting methods with high school and university GPA
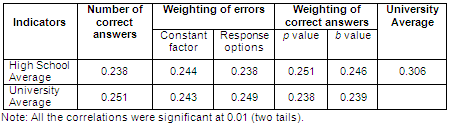
Our starting point for this analysis was the correlation of the number of correct answers on the EXHCOBA with averages from high school and the first semester of college (second column). It can be seen that the predictive validity (0.251) is slightly better than the concurrent (0.238), both being quite moderate rates.
Weighting of errors. In this analysis we started from two premises. First, that errors occur on a continuum of “severity”; which is to say that some errors are more serious than others. Second, that the errors present consistencies; and those who know more, not only make fewer errors, but the errors they make are less severe.
We obtained two types of scores based on errors: (1) equally punishing all wrong answers with a quarter point (0.25), which addresses the probability of guessing at answers on a test with four answer choices, and (2 ) weighting errors according to the frequency with which they were made by the best students in each of the four answer options of the 130 EXHCOBA questions.
The third and fourth columns of Table I present the results of correlating these two methods of error-weighting with school averages. One can see that the predictive validity of the examination in both cases decreased slightly from 0.251 to 0.243 and 0.249. In contrast, the concurrent validity of the test improved slightly from 0.238 to 0.244, when wrong answers were punished. However, the concurrent validity did not change when using the method of weighting the options of incorrect answers.
Weighting of correct answers. In this analysis we assumed that not all correct answers must have the same weight in the score, since the questions differ according to their degree of difficulty. Thus, to the more difficult questions, there must be added more points than to those that are easier.
Two types of scores were obtained based on the difficulty of the question. In the first case, we used the index of difficulty calculated according to the Classical Theory of Measurement, value p. In the second, we used the difficulty of the question, calculated according to Item Response Theory, value b.
The fifth and sixth columns of Table I present the results of the correlations of these two methods of weighting correct answers, with both scholastic averages. It can be seen that the predictive validity of the examination, in both cases, decreased slightly from 0.251 to 0.238 and 0.239. In contrast, the concurrent validity of the test slightly improves when the correct answers are weighted, with both methods, from 0.238 to 0.251 and 0.246.
In sum, we can say that the methods of weighting the EXHCOBA score do not improve the predictive validity of the instrument, although they slightly improve slightly its concurrent validity. We can also say that practically all four weighting methods produce, on the average, equivalent results; although what was slightly the “best” of them was the weighting of correct answers according to the difficulty of the test questions (p-value).
Discussion
The traditional procedure for grading a test has prompted many reflections on the relevance of grading under a binary process, in which all the right and wrong answers have the same values (correct answers = 1, errors and omissions = 0). In this model, neither the difficulty of the question nor the degree of error for a wrong answer is important. The model assumes that two people have the same level of knowledge or skills if both had the same number of correct answers on a test, no matter which answers they got right.
However, we know that our knowledge and skills are not expressed in this binomial of right and wrong answers, but rather, our responses reflect differences in degree which can become very important. To illustsrate this: for example, for someone to think Costa Rica is in Latin America, is not the same as to think it is in Europe.
This appears reasonable, and has motivated many researchers to explore better ways to grade the tests. As we have already seen, the results are contradictory, and lack empirical evidence to support the stance favoring the weighting of test questions. With this in mind we conducted this investigation, and found no evidence to show that it improves the predictive validity of a college entrance examination to weight the errors by degree of plausibility; or right answers, according to their degree of difficulty; thereby strengthening the position of Tristan and Vidal (2000).
We believe that these results may be due to the fact that the test used in this study was not configured for these purposes. That is, it does not provide a gradient of error in the design of the questions; on the contrary, the structure of the questions is designed for right and wrong answers, given a set of “distractors”. Nor is it a test planned with weights relative to right answers on different questions.
Another argument that seems plausible is that the average marks obtained in college and in high school, are not good validation criteria for the purposes of this study, since grading criteria vary from one teacher to another and from one institution to another. This can be seen from that fact that the averages of school marks bear no real connection to each other, because the only correlations obtained were 0.306 between high school and the first semester of the B.A. program. Comparing these results with values reported by Trent and Leland Medsker (1968) of 0.55 between the marks for high school and university, and of 0.50 for academic aptitude tests and university averages, we are aware that ours is quite modest.
While the above is plausible, the results of the concurrent validity contradict these arguments because, paradoxically, with the same weighting procedures and the same criteria for validation, correlations of EXHCOBA with high school grades improved slightly in most cases.
Placing the results on a balance-scale, it seems best to continue to apply traditional methods, until we find better evidence that tell us to do otherwise. However, given that the logical arguments support the idea of weighting the grading of a test, it is important to continue exploring new possibilities based on other weighting procedures and validation criteria, such as differential analysis of the items, calculation of probabilities for answering a question correctly, calculation of probabilities for the examinee’s guessing answers for some questions, and some elements and criteria provided us by modern psychometrics.
References
Backhoff, E., Ibarra, M. A., & Rosas, M. (1995). Sistema Computarizado de Exámenes (SICODEX). Revista Mexicana de Psicología, 12 (1), 55-62.
Backhoff, E. & Tirado, F. (1992). Desarrollo del examen de habilidades y conocimientos básicos. Revista de la Educación Superior, 83, 95-118.
Bravin, J. (1983). Bright idea: Hard courses should carry more weight than easy courses. Executive Educator, 5 (1), 40-30.
Budescu, D. V. (1979). Differential weighting of multiple choice items. Princeton: Educational Testing Service.
Cronbach, L. J. (1971). Test validation. In R. L. Thorndike (Ed.), Educational measurement (2a. ed.). Washington: Consejo Americano en Educación.
Donnelly, M. B. et al. (1983). Simple Adding versus Differential Weighting of MCAT Subtest Scores. Journal of Medical Education, 58 (7), 581-83.
Govindarajulu, Z. (1988). Alternative methods for combining several test scores. Educational and Psychological Measurement, 48 (1), 53-60.
Mislevy, R. & Bock, R. D. (1982). Bilog: Maximum likelihood item analysis and test scoring with logistic models. Mooresville: Scientific Software.
Muñiz, J. (1997). Introducción a la Teoría de Respuestas a los Ítems. Madrid: Pirámide.
Nemecek, P. M. (1994). Constructing weighted grading systems. Clearing House, 67 (6), 325-326.
Nunnally, J. C. & Bernstein, I. H. (1994). Psychometric Theory. New York: Mc Graw-Hill.
Razel, M. & Eylon, B. S. (April, 1987). Validating alternative modes of scoring for coloured progressive matrices. Paper presented at Reunión Anual de la American Educational Research Association. Washington.
Siegel, J. & Anderson, C. S. (1991). Considerations in calculating high school GPA and rank in class. NASS P Bulletin, 75 (537), 96-109.
Sympson, J. B. & Haladyna, T. M. (April, 1988). An evaluation of “polyweighting” in domain referenced testing. Paper presented at Reunión Anual de la American Educational Research Association. New Orleans.
Talley, N. R. & Mohr, J. I. (1993). The case for a national standard of grade weighting. Journal of College Admission, 139, 9-13.
Talley, N. R. & Mohr, J. I. (1991). Weighted averages, computer screening, and college admission in public colleges and universities. Journal of College Admission, 132, 9-11.
Trent, J. W. & Leland, L. M. (1968). Beyond high school: A psychological study of 10,000 high school graduates. San Francisco: Jossey-Bass.
Tristán, A. & Vidal, R. (2000). Análisis de la práctica de asignar pesos a los reactivos y su efecto en el diseño y calificación de pruebas. Proceedings of the IV Foro de Evaluación Educativa, Mexico: Centro de Evaluación de la Educación Superior.
Willis, J. A. (April, 1993). Chapter 1 Eligibility Factors and Weights: Using probit analysis to determine eligibility criteria. Paper presented at Reunión Anual de la American Educational Research Association. Atlanta.
Translator: Lessie Evona York Weatherman
UABC Mexicali
1Without the right to take the semester final, because of not having attended the requisite number of classes, or for some other reason
Please cite the source as:
Backhoff, E., Tirado, F., & Larrazolo, N. (2001). Differential weighting of items to improve university admission test validity. Revista Electrónica de Investigación Educativa, 3 (1).Retrieved month day, year: http://redie.ens.uabc.mx/vol3no1/contents-tirado.html