Revista Electrónica de Investigación Educativa
Vol. 2, No. 2, 2000
Indicators of Educational Development in Latin America
and its Impact on the Economic Levels of the Population
Carlos Muñoz Izquierdo
(*)
carlos_munoz_izquierdo@gse.harvard.edu
Alejandro Márquez Jiménez
(*)
alejandro.marquez@uia.mx
*
Unidad de Investigaciones Interdisciplinares en Educación
Universidad Iberoamericana, campus Santa Fe
Edificio F, Primer Piso
Prolongación Paseo de la Reforma 880
Lomas de Santa Fe, 01210
México, D.F., México
Abstract
Based on the information published by the Economic Commission for Latin America (CEPAL), the authors have followed the growth of the region’s educational systems, mainly during the last decades of the 20th century. The patterns of distribution of educational opportunities among the various economic levels and sexes have also been examined. On the other hand, they have analyzed some impact indicators related to the expansion of educational opportunities within the working fields where graduates of those school systems are, and indicators of the probability of those individuals earning higher wages than those considered as the minimum in many countries to outdo poverty. Finally, some obstacles which have hindered the equal distribution of education have been identified, and some political features necessary to overcome them have been sketched.
Key words: Latin America, schooling rates, distribution of educational opportunities, schooling and work force.
Introduction
This article describes the demographic situation in Latin America, the growth the region’s educational systems have recently experienced, the distribution of scholastic opportunities resulting from this growth, and some of the effects it has had on wages and living standards in the social sectors that have acquired different levels of formal education. The data used were drawn primarily from that published by the Economic Commission for Latin America (CEPAL).1
This work is divided into three chapters, followed by a final recapitulation. In the first chapters, the above-mentioned themes are discussed by means of some of the conceptual tools provided by the human capital theory, the theory of the technical functionality of education and the theory of positional good.2
I. Demographic panorama of Latin America and the Caribbean
During the last two decades of the twentieth century, the population of Latin America and the Caribbean increased by 150 million, rising from 357.6 to 507.3 million people. (See Figure 1). As a result of this demographic dynamic, the population of our country is still young. (60% of it still is under 30, as shown in Figure 2).
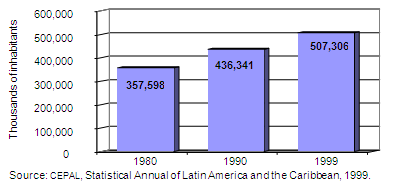
Figure 1. Latin America and the Caribbean: total population, 1980-1999
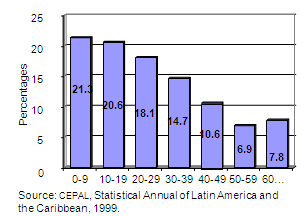
Figura 2. Latin America and the Caribbean: distribution of total
population by age groups, 1999 (percentages)
This growth, in addition to having powered the demand for different levels of school systems in the region, generated what demographers call “high dependency ratios”, since the population that is not of economically productive ages has been greater than that which is able to join the economically-active population. However, demographers themselves predict that during the next three decades this situation will substantially change as a result of decreases being observed in fertility rates. It is expected, in effect, that the relationship between the potentially-productive population and the economically-dependent is leaning toward the opposite direction, so that the economically-dependent population will be getting smaller than the economically-active.
Thus, the population dynamic which until now, has prompted the expansion of demand for education (especially for basic education) will be reflected, first, in a growing demand for high school and higher education, but later on it will boost the growth of the economically-active population (EAP). This provides a unique opportunity—that will not occur again—to boost economic and social development in the region. But to take advantage of the situation, it will be esstential for the economic systems of our countries to have the ability to absorb, by generating enough well-paid jobs, the demographic cohorts that will be reaching economically-productive age.
II. Expansion of school systems in the region
II.1 Evolution of rates of scholarity
Despite the demographic growth mentioned above, the proportions of children and youth who have access to the different educational levels, although they grew slowly during the 80’s, have improved significantly since 1990 (see Figure 3).3 Consequently, the relative rates of illiteracy were reduced dramatically, as shown in Figure 4.
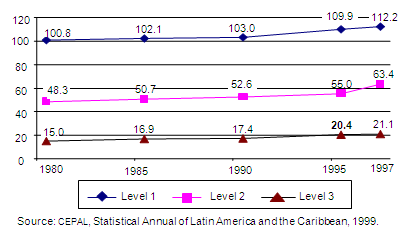
Figure 3. Latin America and the Caribbean: approximate rates of enrollment
in Scholastic Levels 1, 2 and 3 (average rates for the region), 1980-1997.
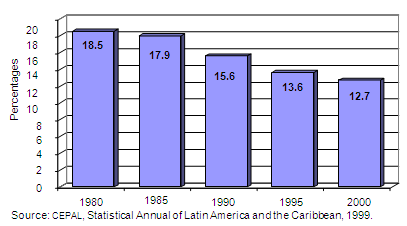
Figure 4. Latin America and the Caribbean: illiterate population,
age 15 years and above, 1980-2000 (average rates for the region)
II.2 Enrollment rates in Latin America compared with those in other countries
Figure 5 compares the impact caused by the development of scholarity rates for different educational levels in various countries’ school systems. As we can see, the rates for elementary education are similar to those recorded in developed countries. It is important to clarify that, in general terms, these rates exceed 100%, which is attributable to the inability to prevent, in enrollment, the inclusion of some students whose ages are not within the range stipulated for that level of education. However, this phenomenon—known as the “coefficient of overage”—appears with an intensity far greater in Latin American nations. In these nations, the coefficients mentioned reached 5.8% for boys, and 10.2% for girls. This clearly means that elementary education in Latin America is not working with the efficiency necessary for all children starting at regulation age, so that they can be promoted annually without having to repeat any of the grades they have already been in.
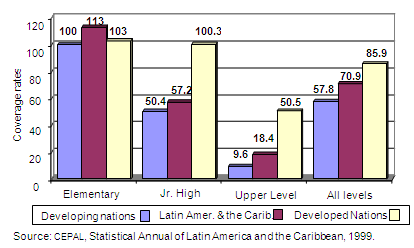
Figure 5. Groups of nations with diverse levels of development:
approximate educational coverage by scholastic level, 1996
This low efficiency generates, in turn, high dropout rates, for various reasons, among which is simply the fact that students enrolled in grades lower than those in which—in a standard school system—they should be enrolled, reach the age at which they are entitled to attend elementary school without being able to complete the corresponding studies.
Because of this, scholarity rates for junior high school education—and, above all, for higher education—remain lower than those registered in Latin America in countries that have achieved greater levels of economic development. The differences observed are of considerable magnitude (57.2% vs 100% in junior high school, and 18.4% vs 50.5% at the high school level). However, as will be seen in Figure 10, these rates (or at least those for higher education) are also positively correlated with the percentages of gross domestic product which in the various countries are devoted to education.
II.3 Distribution of scholarity rates according to the gender of students
Graphs 6, 7 and 8 show how enrollment rates are distributed at different educational levels, according to the gender of the students. Apparently, the participation rate of girls in elementary education is lower than that of boys. However, based on the comments made above, it is very likely that this reflects instead, a difference between the coefficients of overage, whose sign favors the girls; which could further explain that—in secondary education they reach scholarity rates higher than those of boys. Furthermore, it is striking that in higher education, the coefficients of scholarity are equivalent for young people of both genders (see Figure 8).
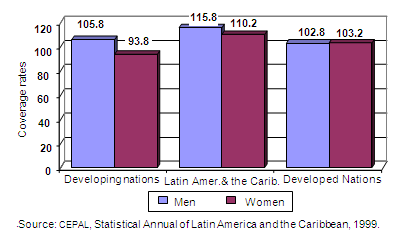
Figure 6. Groups of nations with diverse levels of development:
approximate educational coverage in Scholastic Level 1, by sex, 1996
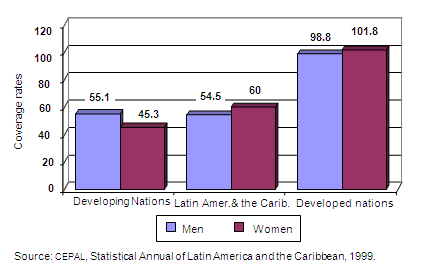
Figure 7. Groups of nations with diverse levels of development:
approximate educational coverage in Scholastic Level 2, by sex, 1996
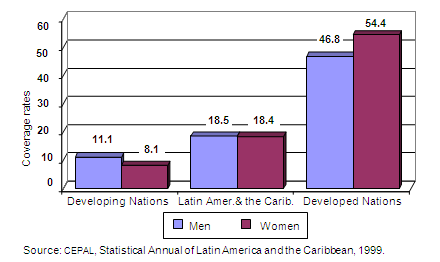
Figure 8. Groups of nations with diverse levels of development:
approximate educational coverage in Scholastic Level 3, by sex, 1996
Finally, Figure 9 shows a synthesis of the information presented in the previous three figures. As we can see here, participation rates of children and young people of both genders, in all education systems in Latin America are practically equivalent.
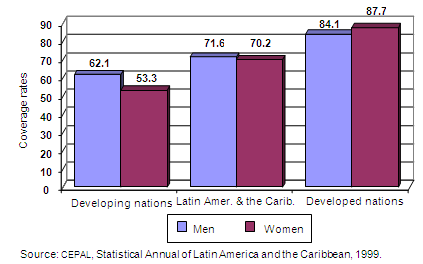
Figure 9. Groups of nations with diverse levels of development:
approximate educational coverage in all scholastic levels, by sex, 1996
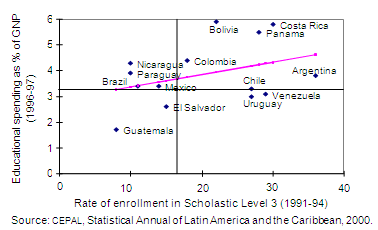
Figure 10. Latin America and the Caribbean: relationship between educational spending as a percentage of the GNP (1997)and the rate of enrollment in Scholastic Level 3 (1991-94)
II.4 Distribution of scholarity according to family income and ages of the subjects
It is noteworthy that in Latin America and the Caribbean, income distribution remains uneven. Figure 11 shows, in effect, that 60% of families in the region receive 30% of the total revenues, while the remaining families (representing 40% of the total) receive 70% of revenue. This affects the social distribution of educational opportunities. Beginning with high school, and particularly in higher education, opportunities tend to cluster in families that earn higher incomes. Specifically, these opportunities are concentrated in 40% of the region’s families (see Figure 12).
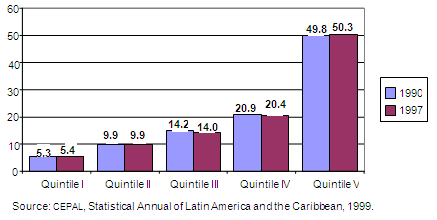
Figure 11. Latin America and the Caribbean:
distribution of family income, by quintiles, 1990-1997
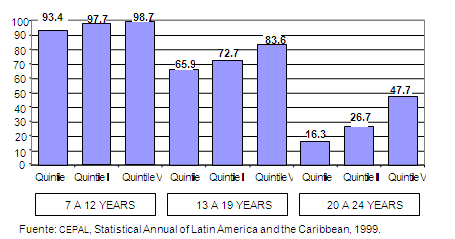
Figura 12. América Latina y el Caribe: asistencia escolar en áreas urbanas,
por nivel de ingreso familiar y grupo de edad, 1997
It is interesting to observe that Latin American youth between the ages of 20 and 24, and who belong to families with incomes in the top quintile of the corresponding distribution, already are reaching enrollment rates similar, on the average, to those the young people who appear, as shown above in Figure 8. In contrast, enrollment rates for young people in the region whose families receive income located in the other quintiles of the distribution mentioned are still much lower than those recorded, on an average, in countries that have achieved greater levels of economic growth.
III. Impact of educational development on economic growth
Among the functions the region’s school systems must carry out is that of contributing to the fight against poverty and the concentration of the nation’s income in a few hands. To meet these goals, it is not only necessary to ensure that educational opportunities are distributed equitably among all sectors of society. It is also essential that all students graduating from educational systems have the opportunity to work at jobs that allow them to benefit in a productive way from the education they have acquired. This requires, in turn, a proper correlation between the development of production systems and school systems.
III.1 School system expansion and growth in labor demand
Unfortunately, there has been no analysis of the relationship between the expansion of Latin American school systems and the growth of the labor demand in the Latin American countries as a group. There are, however, some studies relating to the case of Mexico.4 Next we will talk about the most important results of these studies, since there are various reasons (such as those mentioned at the end of this chapter) to assume that what happened in Mexico is not unlike what has happened in other Latin American nations whose school systems have expanded at a similar pace—and whose patterns of economic growth are comparable to those recorded in Mexico.
In Figure 13 we see that according to the studies cited above, during the fifties, the number of people coming out of5 Mexican institutions of higher education (HEI)— whether or not they had completed their professional studies—was higher than that of the jobs available in the labor markets for individuals who have acquired this level of schooling (at that time there were 1.5 jobs per student leaving the university, that is to say there were three job opportunities for every two individuals). However, during the next decade, the growth of such employment opportunities began to be slower than the number of people coming out of the HEIs. Therefore, from then on, that relationship began to be less than one job per graduate.
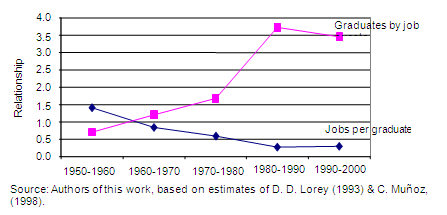
Figure 13. Mexico: comparison of the number of jobs of professional level that have been created, with the total number of graduates from institutions of higher learning
It is particularly interesting to note, furthermore, that the proportion of IES graduates who could get jobs commensurate with their education continued to decline during the subsequent decades, and dropped to 0.27 in the period between 1980 and 1990. This means that since the eighties, nearly four graduates of HEIs (3.73) have had to compete for each one of the few professional-level positions generated in the productive system.
It has been shown, however, that those HEI graduates who cannot find professional-level occupations do not remain unemployed, but are forced to accept jobs that require less schooling than they have acquired. This phenomenon, however, affects not only the subjects coming from HEIs, but also has cascading repercussions for those coming from other levels of education by moving all individuals with less education to lower levels of the occupational scale.
Ultimately, the phenomenon described propels the growth of occupations for the informal sectors of economic systems (whose levels of productivity and job security are known to be much lower than those in the formal-sector occupations).
Concerning this, available statistics reveal that in Latin America the growth of informal-sector jobs has been faster than that of formal-sector jobs, for which the relative share of the former in the region’s total economically-active population region has been increasing. (See Figure 14). This trend is consistent with the hypothesis proposed above, in the sense that the dynamics here analyzed using information that concerns only the case of Mexico, should also be manifesting itself in other countries in the region, although probably with different levels of intensity, associated with different rates of population growth and the expansion of school systems.
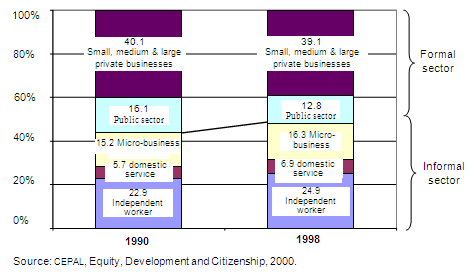
Figure 14. Latin American employment structure (1996 &1997)
III. 2 Open unemployment
In the first place, it is necessary to note that the open unemployment rates for which statistics were available in all countries are based on too-lenient criteria—enough so, in fact, that those individuals who work a few hours a week at some paid economic activity are recorded in the statistics as “employed”. Only those who spend all their time looking for work are considered to be “unemployed”.
This clarification should be taken into account when analyzing the information recorded in Figures 15, 16 and 17. The first figure shows that the unemployment registered in urban areas increased markedly between 1980 and 1985, but has since stabilized at levels close to 9%.
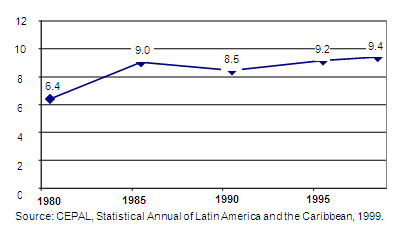
Figure 15. Latin America and the Caribbean:
rates of open urban unemployment, 1980-1998
Meanwhile, Figure 16 shows the relationship existing between unemployment rates and family incomes, since it demonstrates the rates that in several countries affect families whose incomes are in the first and tenth deciles of the corresponding distribution. The figure confirms, as might be expected, that there is an inverse relationship between the two variables. In fact, unemployment rates for families whose incomes are in the bottom decile tend to be concentrated in a range of between 20% and 40%, while those for families whose incomes are in the top decile are in a range of between 0% and 10%. However, in making this inference, it is necessary to point out that this relationship is not found in Mexico, and appears relatively weak in Honduras.
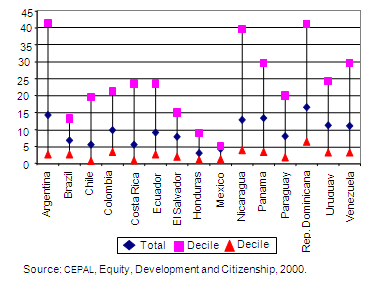
Figure 16. Latin America and the Caribbean: rates of unemployment,
according to the level of family income (1996 & 1997)
III.3 Women’s participation in the EAP: impact on family income
Figure 17 shows the contribution made to the income of their households by women engaged in work for pay. Here it can be seen that families whose incomes are in the lowest quartile of the distribution typically have female-participation rates of between 20% and 35%. In contrast, families with incomes in the upper quartile of distribution generally have rates of over 50% for female participation in the workforce. These results are very useful for analyzing the economic value of schooling, since research has demonstrated a very close relationship between the educational levels that women reach and their rates of participation in the work force.
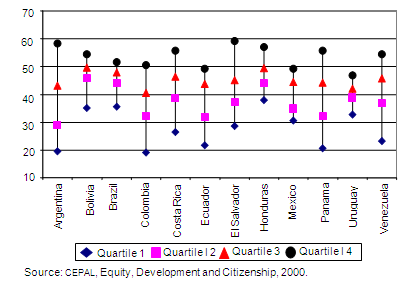
Figure 17. Latin America and the Caribbean: percentage of employed women of active age, according to the level of family income (1996 & 1997)
III.4 Some indicators of the economic value of formal education
Besides boosting the participation of women in the labor force, formal education affects the quality of existing jobs in labor markets, and has a positive correlaton with the earnings of the economically-active population. Figures 18, 19 and 20 give some indications of how these effects are manifested in Latin America.
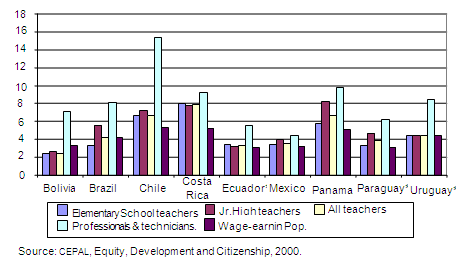
Figure 18. Latin America and the Caribbean: average actual pay of teachers,
professionals and technicians and the total wage-earning population (1996 & 1997)
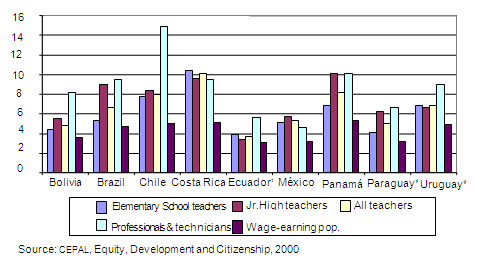
Figure 19. Latin America and the Caribbean: standardized average remuneration of teachers, professionals and technicians and the total wage-earning population (1996 & 1997)
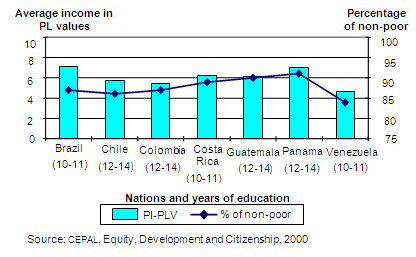
Figure 20. Latin America and the Caribbean: years of education needed to avoid the probability of falling into poverty (urban areas of some countries, beginning of the 90s)
In the first two of these figures, there is a comparison of the wages received in different countries by those who work at jobs requiriing higher levels of schooling (i.e. professionals and technicians, as well as elementary- and junior-high-school teachers) with the average income of the total wage-earning population.6 It is very clear that in all the countries considered in the analysis, the incomes of those working in these occupations are higher than those earned, on the average, by the group of individuals who are paid some salary. However, these differences are not of the same magnitude in all cases. The greatest contrast is found between the cases of Chile and Mexico.
According to conventional economic theory, this observation could be attributable to the fact that qualified personnel are relatively plentiful in the second of those countries. However, this interpretation would not be sufficiently consistent with the available information related to the high degree to which income is concentrated in Mexico. Therefore, we should consider the possibility that the slight difference observed in that country between the incomes of professionals and technicians, on the one hand, and the total salaried EAP, on the other, is attributable to a deficient classification of the workers which the statistics register as “professionals and technicians.”
Finally, Figure 20 shows that over 75% of those individuals who, in different countries, manage to achieve certain levels of schooling have incomes that allow them to live above the line dividing those living in poverty from the rest of the population. (As we can observe, this amount of education ranges between 10 and 14 grades, which exceeds the requirement for completing basic education).
The continuous line shown in this figure refers to the average income received by subjects who had completed the scholastic levels mentioned. These revenues are expressed in a unit of measurement which ECLAC calls “poverty line values” (PL), and which represents the number of times that wages of groups of individuals considered here are higher than those that, in each country, are considered essential staying out of poverty.7
The data presented in these graphs reflect, without a doubt, the economic value which Latin American production systems assign to formal schooling. However, it is also necessary to interpret this in light of the information shown in Figure 7 (above). According to that information, high school (i.e. schooling required in order to have more than a 75% chance of receiving income in excess of that dividing the poor from the non-poor) is only available to 54.5% of males and 60% of females in the region. It follows that as a result of their lack of education, there are still significant proportions of the Latin American population (45.5% of males and 40% of women) who do not and cannot find themselves in the situation described in Figure 20.
IV. Concluding Remarks
The information analyzed here permitted us to observe that the guidelines under which the educational systems of the region’s countries were developed during the last decades of the twentieth century, and the impact which that development has had on living standards of the population, have produced markedly contrasting results.
It was confirmed, on the one hand, that there have been unquestionable advances in the region’s educational development, reflected in the behavior of several indicators of social and economic welfare of the region’s families. However, it was also noted that important challenges remain which, as we will elucidate more fully later on, are determined by various obstacles that produce “bottlenecks” which have been impossible to remove by the educational policies implemented in most countries of the region.
Among the advances detected, we should remember the following:
- Between 1980 and 2000 illiteracy rates were reduced by approximately 30%, going from 18.5% to 12.7%).
- For some educational indicators, the conditions of the female students are now better than those of boys. At the same time, the proportion of young women who have access to higher education is now very similar to that of students of the opposite sex. This has encouraged women’s participation in the workforce and, consequently, has improved the incomes of some families (see Figure 17 of this paper).
- To some extent, the educational development of the region has contributed to combating poverty, since the economically-active population that has obtained a high school education or its equivalent, has a more than 75% chance of receiving income in excess of that which various countries have conventionally defined as required for living above the poverty level.
On the other hand, among the problems yet to be solved are primarily the following:
- The rates of elementary schooling for which regional statistics reveal that significant proportions of children are currently enrolled in grades lower than those which in mainstream education, correspond to their respective ages.
- Opportunities for access to a high school education, and above all, to higher education, remain heavily concentrated in the sectors of the population whose incomes are in the upper deciles of the corresponding distribution. This unequal distribution of opportunities to pursue secondary education means, among other things, that 40% of economically-active women and 45.5% of men participating in the EAP do not have sufficient probabilities of earning enough or more than enough to avoid finding themselves in poverty.
- The absorption of graduates of school systems in the production facilities of Latin America and the Caribbean has been inadequate, as indicated by the growth observed in the number of individuals working in jobs in the informal sectors of the region’s economies.
As we know, the problems associated with overage coefficients8 and with the low rates of enrollment in high school education, are attributable to many causes, which would be impossible to summarize in this paper.9 However, we should remember that although they are causally related to various social, cultural, and economic factors (such as the costs of schooling and deficiencies in the educogenesis of families who are in poverty), also depend on the quality of educational processes being developed in schools attended by children belonging to the most impoverished sectors of the region’s countries. For this reason, these problems cannot be resolved by applying general policies, but require implementing a set of policies and programs focused specifically on improving the quality of education provided in those schools.
It is clear that problems related to inadequate absorption of graduates of school systems have a different origin. We cannot rule out the hypothesis that, to some extent, they are associated with some deficiencies in curriculum design, on the one hand, and the distribution of enrollment between the various branches of school systems, on the other.10 Nevertheless, the results of various studies that have examined the occupational dynamics11 point to the need to review thoroughly the validity of the assumption that economic policies associated with globalization will productively absorb all the young people who will be added annually to the Latin American and the Caribbean EAPs.
Translator: Lessie Evona York-Weatherman
UABC Mexicali
1See Economic Commission for Latin America http://www.eclac.cl/
2Some explanations of these approaches—and their theoretical and methodological implications—are found in Muñoz Izquierdo, Carlos and Maura Rubio Almonacid (1992). Investigaciones sobre las relaciones entre la escolaridad and el empleo. El Caso de Mexico: Evolución histórica -1960-1990- and resultados obtenidos, in Latapí, Pablo (ed.). Lecturas básicas para Investigadores de la Educación, Tomo III. Mexico: Nueva Imagen, and in Muñoz Izquierdo, Carlos (1998). Impacto de la escolaridad en la fuerza de trabajo, in Latapí, Pablo (ed.). Un siglo de educación en Mexico., Tomo I. Mexico: Fondo de Cultura Económica.
3Note that gross scholastic rates shown in this figure are obtained by relating the total number of individuals who are between the ages corresponding to different cycles—or school levels—with students enrolled in the respective cycles.
4See Muñoz Izquierdo, C. (1998). Impacto de la escolaridad en la fuerza de trabajo, in P. Latapí. Pablo (ed.). Un siglo de educación en Mexico Tomo I, Mexico: Fondo de Cultura Económica. (pp. 175-199), and Lorey, David. (1993). The University System. Economic Development in Mexico since 1929. California: Stanford University Press.
5For the puposes of this study we will refer to them as “graduates”, although some may not have completed their professional studies.
6As indicated in the title of Figure 19, the earnings of teachers in elementary and junior high schools appearing in this figure were standardized according to the length of the working day for these individuals.
7It is interesting to note that in comparing the data for the various countries considered in this figure, we notice the existence of a tenuous, direct relationship between the “PL” values and the percentage of subjects who, having obtained certain levels of schooling, are not in poverty. This would invite an investigation as to whether the “PL” units are truly equivalent in all countries or whether, instead, they are based on less stringent criteria in those cases in which the incomes of the subjects who achieved certain levels of schooling rise above the line of poverty to a greater degree (and at the same time, the percentages of those above this line are greater).
8As already noted, these factors, in turn, influence the insufficient terminal efficiency of the elementary schools.
9Some discussions of this theme are found in: Muñoz Izquierdo, C. (3a. reimpr., 1999). Origen and consecuencias de las desigualdades educativas. Mexico: Fondo de Cultura Económica, así como en Muñoz Izquierdo C. et al. (1979). El síndrome del atraso escolar and el abandono del sistema educativo. Revista Latinoamericana de Estudios Educativos, IX (3).
10These factors, however, would be “frictional”, so that might be corrected in the short term.
11These studies and tests have been performed not only in Latin America, but in other countries, including some of the economically developed.
Please cite the source as:
Muñoz Izquierdo, C. & Márquez, A. (2000). Indicators of educational development in Latin America and its impact on the economic levels of the population. Revista Electrónica de Investigación Educativa, 2 (2). Retrieved month day, year from: http://redie.uabc.mx/vol2no2/contents-munoz.html