Revista Electrónica de Investigación Educativa
Vol. 10, Num. 2, 2008
Trends and changes in the system of higher education in
the United States for African-Americans and Hispanics
Nattie Golubov
ngolubov@servidor.unam.mx
Centro de Investigaciones sobre América del Norte
Universidad Nacional Autónoma de México
Torre II de Humanidades, piso 9
Ciudad Universitaria, 04510
México, D. F., México
(Received: January 8, 2007;
accepted for publishing: July 17, 2008)
Abstract
Using a wide variety of statistical sources, particularly those created by government agencies in the United States of America (USA), this article offers a descriptive overview of the insertion of ethnic and racial minorities in the USA higher education system. This process illustrates more profound and general changes within USA society, which have a specific though not exclusive origin in the social transformations that began in the 1960’s and were consolidated in the 1970’s. These changes gave rise to a new polítical, social and cultural space for African-Americans, who waged a powerful battle to gain political and civil rights, which were then extended to the Hispanic population.
Keywords: Higher education, African Americans, Hispanic Americans, Minority Groups, United States of America.
Introduction
Higher education in the United States is a complex system, diversified, and in a constant state of flux. The last two decades have seen important modifications in its structure, objectives and trends, linked in some measure with the economy, demographic shifts and new migrations. Two of the most important differences are the increased number of women in the system at every level, in every institution and in every class; and in the access open to racial and ethnic minorities (Chamberlain, 1991; National Center for Education Statistics [NCES], 2003a, 2003b and 2006; Peter and Horn, 2005). This article focuses on the latter trend, revealing deeper and more generalized shifting and alteration in the organization of United States society, and with an origin distinguishable, but not exclusively so, in the social changes commencing in the sixties and consolidated in the seventies, with implications in the structure of a new political, social and cultural space for these minorities, first for African-Americans and then for Hispanics.
Access to higher educationis1 related with expectations of job improvement and higher income (Justiz, 1994; NCES, 1997; Perez and De la Rosa, 1997; Torres and De la Torre, 1997; Young-Hawkings, 2001), but also with the accumulation of cultural, individual and collective capital, which affects the status of individuals and of groups in the whole of a society, in its cultural and political legitimacy, and in its recognition (Bourdieu, 1988; Gates, 1993). After reviewing various statistical sources, especially those produced by United States government, it is possible to trace an overview descriptive of the insertion of racial and ethnic minorities in the higher education system. While there are various ethnic and racial groups, at least for census purposes,2 only African-Americans3 and Hispanics are considered. These are the two largest groups after non-Hispanic whites, but also are those facing the greatest difficulties in their integration into the educational system.
The panorama which can be constructed, shows a growing proportion of these groups in higher education, but is restricted at higher levels of education and specialization. Their entrance in the system is recent, although it has accelerated during the last few decades. While many African-Americans and Hispanics share socio-economic, sociopolitical and cultural realities, and socio-cultural (marked by higher levels of poverty, political exclusion and cultural inferiority), the process of integration into higher education is different for each group. African-Americans have been involved in the system for decades, in a consistent manner, and have created specific institutions. Hispanics, however, entered the system en masse in the nineties, in consonance with their high population growth, which in 2003 made them the country’s largest ethnic minority (NCES, 2003b).4
Furthermore, although both groups differ significantly from the white population in various aspects, they are also markedly different from one another. African-Americans are a deep-rooted historical group that developed a specific culture in the United States during four centuries (Broussard, 2001; Fass, 1989; Hogan-Garcia, 1997; Lucas, 1994; West, 2001). What the census calls Hispanics, is basically an amalgamation of people from Latin America and the Caribbean, basically, and that includes Chicanos, who have a long historical presence in the United States (Re Cruz, 1997; Sanchez, 1997; Muñoz, 1997), Puerto Ricans who have lived for decades in the country, and South American and Central American immigrants who arrived in recent years—to name a few. The one classification hides a great diversity within each group, which diversity may be as important as their similarities. However, in this article only the intra-group similarities and inter-group differences are considered.
I. Methodology
The data used in this article come from secondary sources, basically from United States federal government organizations. For the demographic description of the ethnic minorities in this country, census information and projective studies were used. For a description of the involvement of these minorities in higher education, statistics from the data system were used, plus specific studies on the involvement of African-Americans and Hispanics in it.
General data were selected, both in terms of demography and education, to build a picture of the involvement of African-Americans and Hispanics in the United States higher education system. There is a large amount of data available on each group, but presenting the details would have kept us from developing a general and critical overview of the issue. We invite the reader interested in further details to consult the cited material, much of which is available online.
The information was presented in context with data on the ethnic minorities in the United States, by demographic, social, political and historical type, while the involvement of these groups in higher education in the country belongs to a more profound, complex and diverse dynamic of social, cultural and political exclusion. The demographic, migratory and political processes permit an understanding of the growing, albeit uneven, integration of African-Americans and Hispanics into the US higher education system.
II. Higher education in a multicultural country
During the twentieth century, the United States became a racially-diverse country. In 1900, one out of every eight US residents was a member of a non-white race; in 2000, one out of every four (Hobbs and Stoops, 2002). This process of ethno-racial diversification was greater than ever during the last decades of the twentieth century and the beginning of the twenty-first. While African-Americans represent the ethnic minority with the longest historical presence, and were the most numerically important during the twentieth century, the population of Hispanic or Latin origin became the most numerous ethnic group, after the whites, and the first ethnic minority in terms of percentage, at the beginning of the twenty-first century. African-Americans and Hispanics are the ethno-racial groups with the highest percentage of young people in a context of a consistently-aging overall population consistent, particularly among non-Hispanic whites (Hobbs and Stoops, 2002; NCES, 2003a and 2003b). The average age of the population of all races is 35.9 years; for non-Hispanic whites, it is 38.6 years; for non-Hispanic blacks, 30.8 years. The youngest population is Hispanic, with an average age of 26.6 years (see Figure 1).
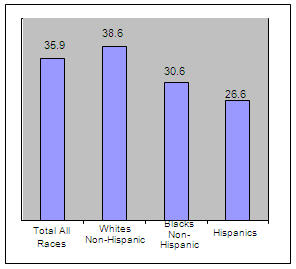
Figure 1. Average age of the United States population by
race/ethnicity for three racial groups in 2000 (NCES, 2003a, p. 22)
The 2000 census recorded a population of 34,658,190 African-Americans in the United States—12.3% of the total population. If we consider only those who identify themselves as black, or black in combination with one or more other races, the figure rises to 36.4 million (Hobbs and Stoops, 2002). By 2020, it is estimated that the African-American population will reach 41.5 million (NCES, 2003a). It is a younger population, with an average of 30.6 years of age (see Figure 1), and a higher fertility rate (18.1 per thousand, as compared to 14.7 per thousand for all races). Twenty-two percent of this population are affected by poverty—more than double the percentage of the white population in the same situation (8%).
In 2000, Hispanics in the US totaled 35.3 million people, and constituted 12% of the population. This is the population group growing fastest and in highest proportion. It increased by 20 million between 1980 and 2000 (see Figure 2).
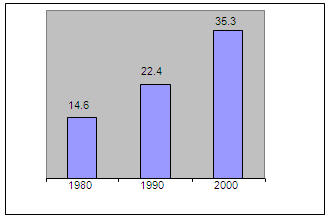
Figure 2. Population of Hispanic origin in the period
1980-2000 (in millions) (Hobbs and Stoops, 2002, p. 78).
It is a young population, averaging 26.6 years of age (see Figure 1); among children it is the greatest ethnic minority. Sixty-two percent of this group were born in the United States, and 21% are among the country’s population living in poverty. It is estimated that by 2050, they will represent 25% of the country's total population (NCES, 2003b).
Higher education in the United States constitutes a complex, highly-differentiated system. A study by the National Center for Educational Statistics (NCES) shows that during the academic cycle 2004-2005 there were 6548 institutions offering some sort of post-secondary education; 68.6% of these institutions were private (29.4% non-profit, 39.2% for-profit), and 31.4% were public. Depending on the type of education offered, 40% were classified as over-four-year institutions; 33% as 2-year institutions and 27% as less than 2 years. According to the highest degree awarded, 41% offered an Associate’s Degree, 6% a Bachelor’s Degree, 10% a Master's Degree, and 16% a Doctor’s Degree5 (Knapp et al., 2005).
Of all the upper-level educational institutions in the United States, 43.7% offered Associate’s Degrees and 35.5%, Bachelor’s Degrees. In the postgraduate area, 26.4% offered Master’s Degrees, and 10.5% offered doctorates. The institutions present a contrast according to the degrees they offer, and the type. The private establishments are looking to make a profit, and so concentrate on the lowest levels and degrees, as to specialties and duration; while the public institutions, and the private, non-profit ones concentrate on the more extensive or specialized degrees (Knapp et al., 2005). Moreover, these two types of institutions are the only ones offering postgraduate degrees: 26% of the public institutions confer a Master’s Degree, as do 53.4% of the private, non-profit institutions. Offering doctorates are 13.2% of the public institutions, and 20.4% of the private, non-profit ones. In contrast, only 0.9% of the private, for-profit institutions offer a doctorate, and 6.2%, a Master’s Degree.
III. African-Americans and Hispanics in higher education
Gaining access to higher education has been difficult for minorities, with the goal only partially achieved (Justiz, 1994; NCES, 1997). In 1990, African-Americans made up 12.3% of the population, but only 8.7% of the enrollment of colleges, and 5.7% of their graduates; the population of Hispanic origin constituted 7.7% of the population, but only 4.9% of enrollment in higher education, and 2.7% of the graduates6 (Justiz, 1994). In 2003, 17.3% of the African-American population 25 years of age or more, had an educational level equivalent to a Bachelor’s Degree or higher.
In the case of the Hispanic population, that percentage was lower: 11.4%. Those Hispanics 25 years or older had an education level lower than the African-Americans; 57% had completed high school, as compared to 80% of the African-Americans, and 29.6% had gone through a college or a similar institution, as opposed to 44.7% of the Afro-Americas of this age range. While in the age group between 25 and 29 years, the number of Hispanics who got an education was greater, this population sector was still lagging behind the other ethnic groups. Thus, 61.7% of the Hispanics had completed high school, as compared to 86.7% of African-Americans; 10% had earned the equivalent of a Bachelor’s Degree or higher, while 17.2% of African-Americans had completed this level of education.7 A 1996 study (NCES, 1997) showed that not only in higher education the participation of minorities was lower, but also lower was their expectation of continuing this type of education after completing high school (see Table I).
Table I. Percentage distribution of high school graduates planning to continue their
education the following year in colleges with 2-year or 4-year
academic cycles in 1972 and 1992 (NCES, 1997, p. 4)
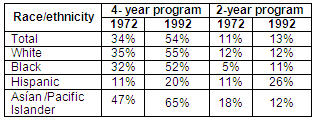
In 1992, 55% of white high-school students planned to continue their education in a 4-year college the year after graduation, as compared to 52% of African-Americans, and only 20% of the Hispanics. However, the latter group represented the largest percentage (26%) of those planning to continue their education in a 2-year program, in comparison with 12% of whites and 11% of African-Americans (NCES, 1997).
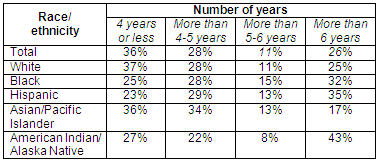
In addition, among students belonging to one of the two minorities, there was a longer time lapse between high school graduation and continuing with higher education (NCES, 1997). In contrast, a lower percentage of these students stayed in school long enough to get a degree, and when they did earn a degree; they took an average of four more years to do it: Thirty-five percent of the Hispanics took more than 6 years to finish a 4-year Bachelor’s Degree program, as compared with 32% of African-Americans and 26% of whites; only 23% of the Hispanics and 25% of the African-Americans earned their degree in 4 years or less (see Table II).
Table II. Percentage distribution of graduates earning their degree
several years after enrollment (1993) (NCES, 1997, p. 25)
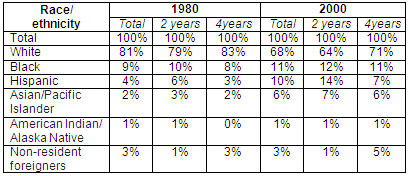
African-Americans have made notable progress in terms of their participation in the United States educational system in general, and specifically in the upper levels, but there are important differences between them and other racial and ethnic groups, especially non-Hispanic whites, who constitute the largest proportion of participants in higher education. Between 1980 and 2000, the share of African-Americans in the US higher-education system rose from 9% to 11% of the total number of students (men and women) enrolled in the system (NCES, 2003a). This advance is appreciably less than that of other ethnic minorities: Hispanics rose from 4% in 1980 to 10% in 2000; and Asians and Pacific Islanders, from 2% to 6% in the same years. However, the most notable change is the smaller relative number of non-Hispanic whites; in 1980, they made up 81% of students enrolled, while in 2000 they were only 68% of the total enrollment—a difference of 13 percentage points in two decades (see Table III).
Table III. Percentage distribution of college and university enrollment
according to race/ethnicity in 1980 and 2000 (NCES, 2003a, p. 93)
In 2000, 31% of African-Americans between 18 and 24 years of age were enrolled in high school or college, a percentage that rose to 39% among those who had completed high school in the same age range (see Table IV).
Table IV. Percentage distribution of enrollment in colleges and universities by population
between 18 and 24 years of age, in 1980 and 1990 (NCES, 2003a, p. 95)

In the case of Hispanics, a gradual advance can be recognized, although in comparison with whites, Hispanics show a considerable lag. In 2000, 22% of Hispanics between 18 and 24 years of age were enrolled in a college or university—6% more than in 1980 (NCES, 2003b)—and 36% of those who had completed high school between the ages of 18 and 24 years were enrolled in a college or university. In this group there were also differences between those born in the United States, and those who were not. Those born in this country have higher rates of enrollment in institutions of higher education than do their immigrant peers. For the year 2000, the rate of enrollment for Hispanics born in the United States, and between 18 and 24 years of age, was similar that of their white peers (see Table IV). The growth of the proportion of Hispanics enrolled in institutions of higher education is due as much to the expansion of the system in numerical terms, as to the growth of the specific demographic of that population. However, they represented only 10% of the enrollment in colleges and universities (see Table III), a percentage that becomes smaller if we consider only the 4-year academic programs which lead to a Bachelor’s Degree.
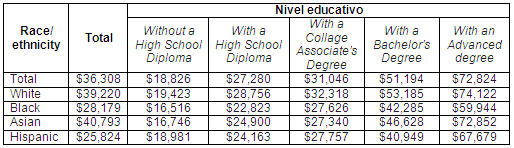
Higher education has a direct impact on the income of individuals, but the uneven distribution is reproduced according to racial and ethnic origin. A Hispanic without a high school diploma earned an average of $18,981 a year in 2000, and an African-American, $16,516. For a Hispanic or African-American with a Bachelor's Degree, that figure rose to $40,949 and $42,285 respectively, and with a postgraduate degree, the average yearly income amounted to $67,679 for a Hispanic, and $59,944 U.S. dollars for an African-American (see Table V). These figures contrast with the income of a non-Hispanic white, who received an average of $53,185 U.S. dollars a year if s/he had a Bachelor’s Degree, and $74,122 if s/he had a postgraduate (Stoops, 2004).
Table V. Average yearly income and educational level according to race/ethnicity
for all workers 18 years of age and over in 2002 (Stoops, 2004, p. 7)
IV. Integration of African-Americans and Hispanics according
to the educational level achieved8
While the proportion of both minorities in higher education increased during the past two decades, a pyramidal integration can be verified. There is a greater proportion, in numerical terms, in the segment comprising the Bachelor’s Degree and Associate’s Degree, and a smaller proportion as the level of specialization increases. At each level there is an increase in proportion; but the differences between these ethnic and racial groups, and the dominant group (non-Hispanic whites), are heightened at the levels of Master’s and Doctoral Degrees. When comparing the 1996-1997 and 2001-2002 academic cycles, one sees an advance in the percentage of Associate’s Degrees earned by African-Americans and Hispanics: 9.6% and 7.8%, to 11% and 9% respectively, for each cycle. For the Bachelor's Degree, the increase among African-Americans is from 8.1% in the school year 1996-1997, to 8.9% in 2001-2002; and for Hispanics, there is an advance from 5.4% to 6.3% during the same periods.
In terms of Master’s and Doctoral Degrees, progress is also consistent, but in the context of lower ratios for both groups in the national total, according to race and ethnicity. In the academic cycle 1996-1997, African-Americans earned 7.3% of the total number of Master’s Degrees conferred, and Hispanics, 4%. For 2001-2002, the former had increased their attainment to 8.8%, and the latter to 4.9%, as compared with 71.6% earned by non-Hispanic whites. The proportion decreases at the PhD level: African-Americans represent 5.2% of the total in the 1996-1997 academic cycle, and 6.8% in 2001-2002; Hispanics earned 3.1% and 4.1%, respectively. In contrast, non-Hispanic whites earned 76.4% of the Doctoral Degrees conferred during the 2001-2002 academic cycle.
4.1 Associate’s Degree and Bachelor’s Degree
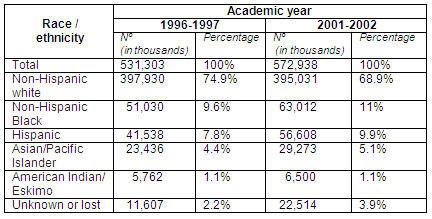
In the 2001-2002 school year, 572,938 people earned Associate’s Degrees; of these, 63,012 were African-Americans, and 56,608 were Hispanics (Goan and Cunningham, 2006). Both minorities earned more Associate’s Degrees than in the 1996-1997 cycle. The African-Americans’ achievement rose from 9.6% to 11%, and the Hispanics from 7.8% to 9% (see Table VI).
Table VI. Associate’s Degree by race/ethnicity earned during the academic cycles
1996-1997 and 2001-2002 (Goan and Cunningham, 2006, p. 11)
In the case of the Bachelor’s Degree, during the 2001-2002 academic period, 908,692 were earned. Of those earning their Bachelor’s, 110,619 were African-Americans, and 78,523 were Hispanics. For the period 1996-1997, African-Americans earned 8.1% of the total, and Hispanics, 5.4%. In 2001-2002, those percentages went up to 8.9% and 6.3% respectively (see Table VII).
Table VII. Bachelor’s degree by race / ethnicity earned during the academic cycles
1996-1997 and 2001-2002 (Goan and Cunningham, 2006, p. 20)
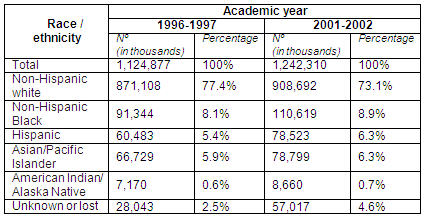
The largest increase was among Hispanics, with a variation of 29.8% between one academic cycle and the next, as compared to 21.1% among African-Americans. However, the largest group is composed of non-Hispanic whites, who earned 73.1% of the Bachelor’s Degrees gained during the 2001-2002 academic term. On the other hand, in a comparison of the two academic cycles, the relative number of non-Hispanic whites had decreased by 4.3%.
According to the 10 most popular fields of study for a Bachelor’s Degree, the differences between the racial and ethnic groups studied, and the national trend are not significant (NCES, 2003a). During the 1999-2000 academic cycle, 22% of the African-Americans got their Bachelor’s Degrees in Business, as compared with 21% of the national total; 11% majored in Social Science and History, as against a national total of 10%; 7% majored in Psychology and 7% in Education, as compared to the national totals of 6% and 9%, respectively. The fields with fewer African-American majors were Engineering, and Visual and Scenic Arts, with 4% and 3%, respectively, as compared to 6% and 5% of the total number of degrees earned in these areas (see Table VIII).
Table VIII. Percentage of Bachelor’s Degrees conferred upon all Hispanics and non-Hispanic African-Americansbycolleges and universities in the 10 most popular fields of study during the 1999-2000 academic cycle (NCES, 2003a, p. 99; NCES, 2003b, p. 101)
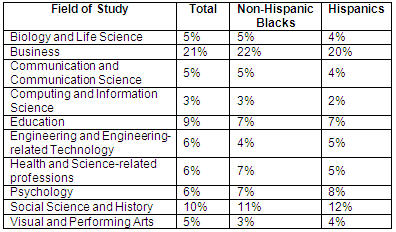
In the case of the Hispanics, the fields of Business, Social Science and Psychology are those with greater participation: 20%, 8% and 12% respectively, versus 22%, 6% and 10% total (NCES, 2003b ). Participation is lower in areas such as Biology and Life Science, 4% vs. 5% nationally; in Communication and related technologies, 4% vs. 5% nationally; in Engineering, 6% vs. 5% nationally; and the medical sciences, 5% vs. 6% nationally (see Table VIII).
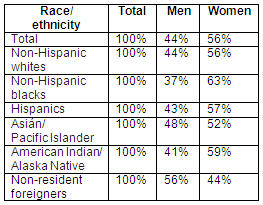
Moreover, if enrollment in colleges and universities is discussed from a gender perspective, it can be seen that women represent 56% of the total, and that in all the races and ethnic groups they are in the majority (NCES, 2003a and 2003b). Among non-Hispanic whites, women represent 56% of the total enrollment for their racial group, and among Asians and Pacific Islanders, 52%. The difference is most prominentamong African-Americans, with women making up 63% of the enrollment, and men, 37%—which is considered one of the most important and revealing features of this racial group’s integration into US higher education. Among Hispanics, although the difference does not present so great a contrast, it is significant: women represent 57% of the total, and men, 43%, a difference of 14 percentage points (see Table IX).
Table IX. Distribution of enrollment percentage in colleges and universities
according to sex and race/ethnicity in 2000 (NCES, 2003a, p. 94)
4.2 Post-graduate degrees: Master’s Degree and Doctorate
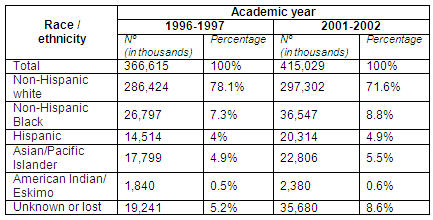
During the 1996-1997 academic cycle, a total of 366,615 Master’s Degrees were earned in the United States. Of those who earned them, 7.3% (26,797 individuals) were African-American students, and 4% (14,514 individuals) were Hispanics. Non-Hispanic whites accounted for 78.1% of the total. In the 2000-2001 academic cycle, there were 36,547 African-Americans, or 8.8% of those earning Master’s Degrees. The Hispanics, 20,314 individuals, made up 4.9% of the total 415,029 (Goan and Cunningham, 2006). Of these, 71.6% were earned by non-Hispanic whites (see Table X).
Table X. Master’s Degrees earned, according to race/ethnicity during the academic cycles
1996-1997and 2001-2002 (Goan and Cunningham, 2006, p. 29)
In the case of the African-Americans the escalation was more noticeable, increasing 1.5 percentage points from one year to the next, while the proportion of Hispanics increased by 0.9 points. However, the most noticeable change is in the relative number of non-Hispanic whites, which decreased by 6.5 percentage points in less than four years. During the 2001-2002 academic cycle, ethnic minorities as a whole accounted for 19.8% of the total number of Master’s Degrees earned (Goan and Cunningham, 2006).
Regarding the most important areas of study for the 1999-2000 academic cycle, 34% of the Master’s Degrees conferred upon African-Americans were in the field of Education, as compared to 27% of the total number of degrees, not taking race or ethnicity into consideration. It also highlights the field of Public Administration, in which are concentrated 11% of the degrees conferred upon this group, as contrasted with 6% of the total Master’s Degrees earned on a national level (see Table XI) (NCES, 2003a and 2003b).
Table XI. Percentage of Master’s Degrees awarded to non-Hispanic African-Americans and to Hispanics by colleges and universities in the 10 most popular fields of study during the 1999-2000 academic cycle (NCES, 2003a, p. 99; NCES, 2003b, p. 101)
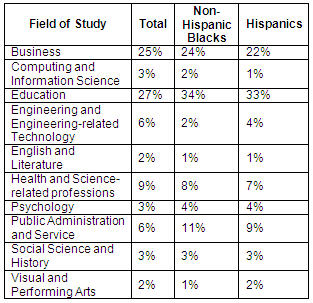
In areas of Health Sciences, Computing and the Visual and Performing Arts, the participation was lower, with 2%, 8% and 1% respectively, compared with national rates of 3%, 9% and 2% for each one. The difference is particularly marked in observing the national total of Master’s Degrees conferred in the field of Engineering, when compared to those awarded to African-Americans: 6% to the 2% total for this group (see Table XI).
The case of the Hispanics shows a similar concentration on Education and Public Administration (33% and 9% respectively), but is lower in areas such as Computing and Computer Science (1%) and in the Health-related professions (6%, versus 3% and 9% of the total, respectively). The proportion of African-Americans is higher in fields such as Engineering (4%, vs. 6% of the total), and the Visual and Performing Arts (with 2%, equivalent to the total number of Master’s Degrees conferred by area of study (see Table XI).
A review of the figures on PhDs shows 34,199 conferred during the 1996-1997 academic cycle. Of these, African-Americans earned 5.2%, and Hispanics, 3.1%; while non-Hispanics whites earned 78.9% (Goan and Cunningham, 2006). For the 2001-2002 academic period, a total of 33,220 degrees were conferred, of which 6.8% were earned by African-Americans, and 4.8% by Hispanics, as compared with 76.2% by non-Hispanic whites (see Table XII).
Table XII. Doctoral Degrees by race / ethnicity during the academic
cycles 1996-1997 and 2001-2002 (Goan and Cunningham, 2006, p. 38)
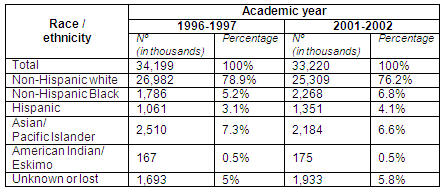
While here an advance can be seen, the more specialized the degree conferred, the more reduced is the presence of both minorities. During the academic cycle 2001-2002, only 1351 Hispanics completed a doctoral degree, out of a populatioin estimated at 35 million persons. The most significant advance was among the African-Americans, who rose 1.6 percentage points in their achievement of doctoral degrees in the two academic cycles, going from 1,786 doctorates in 1996-1997, to 2,268 in 2001-2002. Hispanics, during the same period, earned 1,061 and 1,351, respectively.
If an analysis is made of the areas in which these doctorates were conferred, marked differences can be detected between the totals apart from race or ethnicity, or minorities studied. In the field of Education, just as in the case of Master’s Degrees, there is a significant representation of African-Americans and Hispanics, with 36% and 20% respectively, which far exceeds the total of 15% (NCES, 2003a and 2003b ). The percentage of African-Americans who earned PhD Degrees in the field of Education exceeds the total by 21 percentage points, apart from race or ethnicity (15%). In the case of Social Sciences and History, they represent 9% of the total number of degrees conferred, 9% for African-Americans and 10% for Hispanics; Psychology shows the figures of 10% and 17% respectively against a 10% total, the most pronounced difference between the percentage of total degrees conferred and those related specifically to Hispanics, with 7 percentage points (see Table XIII).
Table XIII. Percentage of doctorates conferred upon Hispanics and non-Hispanic African-Americans by colleges and universities in the 10 most popular fields of study in the academic cycle 1999-2000 (NCES, 2003a, p. 99; NCES, 2003b, p. 101)
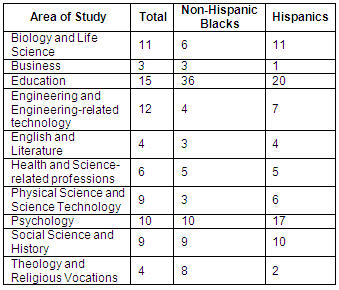
In other areas, except in Business and Theological Studies, the presence of Hispanics is higher than that of African-Americans. Thus, 11% of the Doctoral Degrees were conferred upon this group in the field of Biology and of Life Science (percentage equivalent to the total), against 6% of the African-Americans; the same occurs with Engineering and Physical Science, with 7% and 6%, versus 4% and 3% for the African-Americans, respectively (see Table XIII). However, both groups have lower participations in these areas, in comparison with the totals for the 1999-2000 academic cycle: 12% to 9% for Engineering and Physical Sciences. African-Americans show greater participation in Business than do Hispanics, with 3% (equal to the total number of doctorates conferred in this field of study) and in Theological Studies and Religious Vocations, with 8%, which exceeds the total of 4% and 2% for Hispanics (see Table XIII).
V. Conclusions
The United States system of higher education is complex, and the integration of African-Americans and Hispanics occurs accordingly. While recent decades have showed remarkable and consistent progress regarding the participation of both groups in this system, there is still noteworthy imbalance in their socioeconomic, sociocultural and political situation when compared to that of their non-Hispanic white peers. They therefore form part of an array of realities of social margination and racial and cultural bias.
These two groups represent the most important racial and ethnic minorities in the United States; although they have similarieties, there are enormous differences between them, both historically and politically, and even in their constitution as minorities. Given the historical roots of the African-Americans, there should be considered the constant growth of the Hispanics, the increasing arrival of persons belonging to these groups and the realities that are beginning to be configured with regard to their presence in the country.
When reviewing their process of integration into the US system of higher education, such differences must be addressed. Both groups have progressed since the eighties, although there is a greater body of historical data for the entrance of African-Americans. We also must also respect the differences within each group. Among Hispanics the most important differences are based upon place of birth, so that those born in the United States present higher figures of integration into the system than do those born outside the country. Among African-Americans the differences are structured along a gender axis, with women integrated into the higher education system in a significantly higher proportion than men.
For both groups, we see a pyramidal-type integration. Participation is greater in the lower degrees of specialization (Bachelor and Associate) and lowest at the highest levels (Master’s and Doctorate). Also, both minorities tend to study courses related to Education, Public Administration and the Social Sciences and Psychology, and to show a lesser presence in fields such as Engineering, Computing and Physical and Life Sciences. Given the growing importance of knowledge as an engine of economic growth, this lesser representation of African-Americans and Hispanics in key areas of economic development, will suppose a lesser influence over decisions made there and along the way. In contrast, education and public administration will have an increasingly changing face, perhaps predominantly linked with these two groups. Both are fields of cultural and political influence, capable of determining the future of both minorities.
References
Bourdieu, P. (1988). La distinción. Criterios y bases sociales del gusto (M. C. Ruiz, Trad.). Madrid: Taurus. (Original work published 1984).
Broussard, A. (2001). El movimiento por los derechos civiles y la lucha de los negros por la libertad, 1945-1968. In B. Driscoll & P. Márquez-Padilla (Eds.), El color de la tierra. Las minorías en México y Estados Unidos (pp. 99-108). Mexico: Universidad Nacional Autónoma de Mexico, Centro de Investigaciones sobre América del Norte.
Chamberlain, M. K. (1991). Women in academy: Progess and prospects. New York: Russell Sage Foundation.
Fass, P. (1989). Outside in. Minorities and the transformation of American education. New York: Oxford University Press.
Gates, H. L. Jr. (1993). Integrating the American mind. In H. L. Jr. Gates (Ed.), Loose canons. Notes on the culture wars (pp. 105-120). Oxford: Oxford University Press.
Goan, S. K. & Cunningham, A. F. (2006). Degree completions in areas of national need, 1996-97 and 2001-02. Washington, DC: U.S. Department of Education, National Center for Education Statistics.
Hobbs, F. & Stoops, N. (2002). Demographic trends in the 20th Century. U.S. Census Bureau, Census 2000 Special Reports. Washington, DC: US Government Printing Office.
Hogan-Garcia, M. (1997). African-American as cultural group. In L. Naylor (Ed.), Cultural diversity in the United States (pp. 145-158). Westport, CT: Bergin & Garvey.
Justiz, M. (1994). Demographic trends and the challenges to American higher education. Minorities in higher education. In M. Justiz, R. Wilson & L. Bjork (Eds.), Minorities in higher education (pp. 1-21). Phoenix, AZ: American Council on Education-The Oryx Press.
Knapp, L. G., Kelly-Reid, J. E., Whitmore, R. W., Cong, J., Levine, B., Berzofsky, M. & Broyles, S. G. (2005). Postsecondary institutions in the United States: Fall 2004 and degrees and other awards conferred: 2003–04. Washington, DC: US Department of Education, National Center for Education Statistics.
Lucas, C. (1994). American higher education: A history. New York: St. Martin’s Press.
Muñoz, C. (1997). The quest for paradigm: The development of Chicano studies and intellectuals. In A. Darder, R. Torres & H. Gutiérrez (Eds.), Latinos and education. A critical reader (pp. 439-453). New York: Routledge.
National Center for Education Statistics (1997). Minorities in higher education national center for education statistics findings from the condition of education. Washington DC: US Department of Education, National Center for Education Statistics.
National Center for Education Statistics (2003a). Status and trends in the education of blacks. Washington, DC: US Department of Education, National Center for Education Statistics.
National Center for Education Statistics (2003b). Status and trends in the education of Hispanics. Washington DC: US Department of Education, National Center for Education Statistics.
National Center for Education Statistics (2006). Condition of education 2006. Washington DC: US Department of Education, National Center for Education Statistics.
Pérez, S. & De la Rosa, D. (1997). Economic, labor force, and social implications of Latino educational and population trends. In A. Darder, R. Torres & H. Gutiérrez (Eds.), Latinos and education. A critical reader (pp. 45-79). New York: Routledge.
Peter, K. & Horn, L. (2005). Gender differences in participation and completion of undergraduate education and how they have changed over time. Washington, DC: US Department of Education National Center for Education Statistics-US Government Printing Office.
Re Cruz, A. (1997). The Mexican-American Community in the United States. In L. Naylor (Ed.), Cultural Diversity in the United States (159-176). Westport, CT: Bergin & Garvey.
Sánchez, G. (1997). History, culture, and education. In A. Darder, R. Torres & H. Gutiérrez (Eds.), Latinos and education. A critical reader (pp. 117-134). New York: Routledge.
Torres, R. & De la Torre, A. (1997). Latinos, class, and the US political economy: Income inequality and policy alternatives. In A. Darder, R. Torres & H. Gutiérrez (Eds.), Latinos and education. A critical reader (pp. 95-113). New York: Routledge.
Stoops, N. (2004). Educational attainment in the United States: 2003, Population characteristics. Retrieved september 26, 2006 from: http://www.census.gov/prod/2004pubs/p20-550.pdf
West, E. (2001). La literatura afroamericana y la dinámica de la identidad interracial. In B. Driscoll & P. Márquez-Padilla (Eds), El color de la tierra. Las minorías en México y Estados Unidos (pp. 73-86). Mexico: Universidad Nacional Autónoma de México, Centro de Investigaciones sobre América del Norte.
Young-Hawkings, L. V. (2001). Los afroamericanos en la educación pública: tendencias y problemas. In B. Driscoll & P. Márquez-Padilla (Eds.), El color de la tierra. Las minorías en México y Estados Unidos (pp. 167-190). Mexico: Universidad Nacional Autónoma de México, Centro de Investigaciones sobre América del Norte.
Translator: Lessie Evona York-Weatherman
UABC Mexicali
1For statistical purposes, we use the term ‘post-secondary education’, which encompasses all institutions and educational activities related to the level after high school in the United States, and secundaria, in Spanish-speaking countries. A central feature of this level of the U.S. educational system is its diversity, both in the institutions that comprise it, and in its students. There are several types of academic degrees, on the part of public or private institutions, non-profit, or for- profit (NCES, 2006).
2The United States Census Bureau notes that “race and ethnicity are separate concepts, as defined by the Federal Government. A specific race of people may have different ethnic backgrounds, and people with a particular ethnicity can be of any race” (Hobbs and Stoops, 2002, p. 71). This office distinguishes, for census purposes, among Whites, Blacks, American Indians and Alaska Natives, Asians and Pacific Islanders, and some other races. The population of Hispanic origin lies in the latter category, and for purposes of federal statistics, can be from any country. Moreover, the 2000 census was the first that allowed individuals to identify themselves as being of more than one race.
3We use the term ‘African-American’ by way of preference, since it reflects a political struggle over the language and processes of self and social identity. However, the statistical term is black, so that at certain times it is used to maintain fidelity to the sources consulted.
4Between the years of 1980 and 2000 the population of Hispanic origin doubled (Hobbs and Stoops, 2002).
5The Associate’s Degree is a degree obtained after completing a two-year study program at the level licenciatura, and equals a technical degree in the Mexican educational system. A Bachelor’s Degree requires at least four years of study, and equals a licenciatura. The Master’s Degree (maestría) is a postgraduate degree which requires one or dwo years of study; and the Doctoral Degree/PhD (doctorado) is the highest given, and requires mastery of a field of study and a demonstration of the ability to carry out academic reseearch. To enter a doctoral program, it is usually necessary to have a Master’s Degree. In this article, we have used the English terms, since they describe the United States system with greater precision.
6In the United States there are two types in institutions which impart post-secondary education: colleges and universities. A college is a post-secondary institution which offers liberal or general education, which usually leads to obtaining a degree of Bachelor or Arts or Bachelor of Science, a professional degree, or a Master’s Degree or doctorate. A university is a post-secondary institution which has a school of arts or humanities, a varied postgraduate program, and mor than one professional school, accredited to confer degrees in various fields of study
7These differences are considerable amplified if the Latino population is compared with the Non-Hispanic White. In this group, between 25 and 29 years of age, 87.6% finishes high school, and 34.2% have a Bachelor’s Degree, or higher (Stoops, 2004).
8Of the complexity described as characteristic of the US post-secondary education, we we consider only the degrees of “Bachelor’s” and “Associate”, which are in some sense equivalent to the licenciaturas of the Mexican system, and the educación técnica, respectively, and the Master’s Degree and PhD (doctorate).
Please cite the source as:
Golubov, N. (2008). Trends and changes in the system of higher education in the United States for African-Americans and Hispanics. Revista Electrónica de Investigación Educativa, 10 (2). Retrieved month day, year, from: http://redie.uabc.mx/vol10no2/contents-golubov.html