Revista Electrónica de Investigación Educativa
Vol. 2, No. 1, 2000
On the Use of Concept Maps as an
Assessment Tool in Science:
What we have Learned so Far
María Araceli Ruiz Primo
aruiz@leland.stanford.edu
School of Education
Stanford University
485 Lasuen Mall
94305-3096
Stanford, California, USA
(Received: February 14, 2000;
accepted for publishing: March 22, 2000)
Abstract
In this paper I describe concept maps as an assessment tool to measure one aspect of achievement, the organization of propositional (declarative) knowledge in a domain. A concept map-based assessment consists of a task that elicits structured knowledge, a response format, and a scoring system. Variation in tasks, response formats, and scoring systems produce different mapping techniques that may elicit different knowledge representations, posing construct-interpretation challenges. This paper provides an overview of the research on the technical characteristics of concept maps. It briefly describes some of the studies that have been conducted to this end, and what we have learned so far about this form of assessment.
Key words: Concept map-based assessment, assessment of student knowledge, alternative assessments in science.
Introduction
Achievement testing is lacking a reasonable definition of what achievement is to guide measurement. We treat achievement as a "construct" and translate it into a "test score" as indicator of that construct. Probably this is the reason why the saying that intelligence is "what intelligence tests measure" is an apt description of academic achievement: "achievement is what multiple-choice and short-answer tests measure." We know that measuring achievement is more than the numerical composites of traditional evaluations.
In a previous paper, we (Shavelson & Ruiz-Primo, 1999) sketched a broader notion of achievement than is implied by current achievement testing practice. This definition recognizes three different types of domain knowledge: propositional, procedural, and strategic. Propositional knowledge is knowing that something is so. Procedural knowledge is knowing how to do something. And strategic knowledge is knowing which, when, and why specific knowledge is applicable in a particular context. These three types of knowledge can be characterized as extent, structure, and other features such as precision and automaticity.
This broader definition of achievement demands a larger array of measurement instruments than typically used in testing achievement. We have begun to link this framework to different kinds of assessment methods. For example, multiple-choice and short-answer achievement tests do a reasonably good job in measuring the extent of propositional (declarative) knowledge. Indeed, a remarkable technology of multiple-choice and short answer testing has been developed and used extensively.
However, our notion of what it means to achieve in a domain goes beyond the idea that propositional knowledge is a set of factual and conceptual "beads on chain." For propositional knowledge to be "usable," the bits of information need to be interrelated conceptually. Concept interrelatedness is an essential property of knowledge, and one aspect of competence in a domain is well structured knowledge. A potential instrument to capture important aspects of this interrelatedness between concepts is concept maps (e.g. Ruiz-Primo & Shavelson, 1996a). It can be easily argued that the structure dimension of knowledge yielded by concept maps is unique in comparison to traditional achievement tests.
Still, this other dimension of propositional knowledge, structure, stops short of what might be conceived as science achievement. We need to provide students with the opportunity to display their procedural and strategic knowledge—the application of knowledge for solving problems in a domain. Performance assessments (e.g., Ruiz-Primo & Shavelson, 1996b) have been thought of as assessments that can tap students’ procedural and strategic knowledge. For example, science performance assessments invite student to conduct a hands-on investigation to test a hypothesis or solve a problem. Students plan and carry out an investigation, and report and interpret their findings. Whether a particular assessment will be tapping procedural or strategic knowledge is a matter of the alignment between the characteristics of the assessment task and the students’ learning experiences.
Needless to say, the technology for using and evaluating these new instruments for assessing achievement is currently being researched intensively. Over the past four years, we have done research intended to inform a concept-map-assessment knowledge base (Ruiz-Primo & Shavelson, 1996a; Ruiz-Primo, Schultz, & Shavelson, 1996; Ruiz-Primo, Schultz, & Shavelson, 1997; Ruiz-Primo, Schultz, Li, & Shavelson, 1999; Ruiz-Primo, Shavelson, Li, & Schultz, 2000). Our goals have been to provide not only evidence about reliability and validity of concept map assessments, but also a framework that can guide further research in this area.
This paper focuses on one instrument for measuring achievement in science that is consistent with the broader notion of achievement we propose. More specifically, the paper focuses on concept maps as an instrument to assess students’ knowledge structure (or connected understanding) and provides information about its technical quality.
The first section of the paper focuses on conceptualizing concept maps, what they are and how they can be conceived as an assessment instrument. Then, I present the general characteristics of the research we have conducted, followed by a brief description of some of the studies we have carried out. The paper ends with some general conclusion about what we have learned on concept maps-based assessment and what still needs to be done in this area.
Concept maps
Cognitive psychologists posit that "the essence of knowledge is structure" (Anderson, 1984, p. 5). Research in the cognitive aspects of science learning has provided evidence that professional scientists and successful students develop elaborate, well-differentiated, and highly integrated frameworks of related concepts (e.g., Chi, Feltovich, & Glaser, 1981; Glaser & Bassok, 1989; Mintzes, Wandersee, & Novak, 1997; Pearsall, Skipper, & Mintzes, 1997; Shavelson, 1972). This means that as expertise in a domain grows, through learning, training, and/or experience, the elements of knowledge become increasingly interconnected (cf. Chi, Glaser, & Farr, 1988). Indeed, expert performance seems to lie in the organization of the expert’s domain knowledge. Experts possess a large knowledge base (what we have called extent of knowledge) that is organized into elaborate, integrated structures, whereas novices tend to possess less domain knowledge and a less coherent organization of it (cf. Chi, Glaser, & Farr, 1988; Zajchowski & Martin, 1993).
Assuming that knowledge within a content domain is organized around central concepts, to be knowledgeable in the domain implies a highly integrated conceptual structure among those concepts. Researchers have taken different representational approaches to capture this organizational property of knowledge (e.g., Goldsmith, Johnson, & Acton, 1991; Novak & Gowin, 1984; White & Gunstone, 1992). Among these approaches, concept maps have been proposed as a more direct approach (see Ruiz-Primo & Shavelson, 1996a) to capture the interrelatedness among concepts in a domain.
Formally, a concept map is a graph consisting of nodes and labeled lines (Figure 1). The nodes correspond to important terms (standing for concepts) in a domain. The lines denote a relation between a pair of concepts (nodes). And the label on the line tells how the two concepts are related. The combination of two nodes and a labeled line is called a proposition. A proposition is the basic unit of meaning in a concept map and the smallest unit that can be used to judge the validity of the relationship drawn between two concepts (e.g., Dochy, 1996). Concept maps, then, purport to represent some important aspects of a student's propositional (declarative) knowledge in a content domain (e.g., chemistry).
Although the potential use of concept maps for assessing students' knowledge structures has been recognized, maps are far more frequently used as instructional tools than as assessment devices (see Ruiz-Primo & Shavelson, 1996a for examples on both uses).
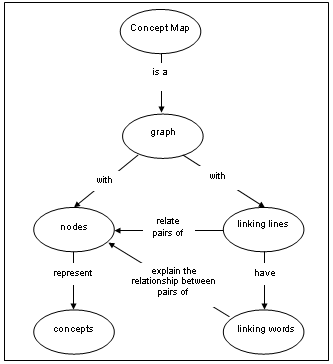
Figure 1. A concept map of what a concept map is
Concept maps, as assessments, can be thought of as a set of procedures used to measure important aspects of the structure/organization of a student's declarative knowledge. We use the term "assessment" to reflect our belief that reaching a judgment about an individual's achievement in a domain requires an integration of several pieces of information; we consider concept maps as potentially one of those pieces (see Cronbach, 1990).
Concept map-based assessment
Intuitively, the use of concept maps to evaluate students' procedural (declarative) knowledge structure is appealing. A student's map construction directly reflects, to some degree, her or his understanding in a domain. Nevertheless, before adopting maps for assessment, more needs to be known about them. A common understanding is needed as to what a concept map assessment is and whether it provides a reliable and valid measure of students' knowledge structure (Ruiz-Primo & Shavelson, 1996a).
We (Ruiz-Primo & Shavelson, 1996a) have characterized concept maps assessments by: (a) a task that invites a student to provide evidence bearing on his or her knowledge structure in a domain, (b) a format for the student's response, and (c) a scoring system by which the student's concept map can be accurately and consistently evaluated. Without these three components, a concept map cannot be considered as a measurement tool.
This characterization has made evident the enormous of variation in concept mapping techniques used in research and practice. This variation emerged from differences in the nature of the mapping tasks, the characteristics of the response formats, and the characteristics of the scoring systems (see Ruiz-Primo & Shavelson, 1996a for a formal representation of these variations).
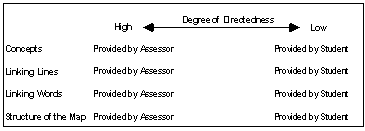
It is very likely that different mapping techniques may be tapping different aspects of knowledge structure. Take, for example, the nature of a mapping task. One dimension in which tasks can vary is the constraints imposed on students in representing their connected understanding. We have named this dimension "directedness" (Ruiz-Primo et al., 1999). We characterized concept-map techniques as having different degrees of directedness (Figure 2).
Figure 2. Degree of directedness in the concept assessment tasks
At the left extreme of the continuum mapping techniques are high-directed, students do not select the concepts to be used in the map, or which concepts to connect, or the words for explaining the relationship between the concepts, or the structure of the map. What, then, do students do in this type of mapping technique? They can fill-in blank parts of a skeleton map with the information provided (e.g., concepts or linking words). At the right end, mapping techniques are low-directed, students are free to decide which and how many concepts to include in their maps, which concepts are related, and which words to use to explain the relation between the concepts. We reasoned that the task demands imposed on students by high- and low-directed techniques are different since more informed decisions need to be made by students in a low-directed technique; the cognitive demands required by a low-directed technique seem to be higher than those required by a high-directed one.
If concept maps are to be used as a measurement tool, we must take the time and effort to provide evidence on the impact of different mapping techniques for representing a student’s connected understanding, as well as information on its technical characteristics. The following questions have guided our research on issues related to reliability: Can raters (scorers) consistently score concept maps? Are map scores sensitive to the sampling of the concepts used? Do different types of scores reflect the students' connected understanding similarly? As for validity: Do different mapping techniques produce scores that can be interpreted in the same way? Do different mapping techniques pose different cognitive demands on students? Are mapping techniques able to differentiate between more and less competent students?
Studying concept maps
In this section I describe the general characteristics of the research we have conducted. The issues discussed here are the mapping techniques we have studied, the approaches we have used to score the maps, how we have trained students to construct a map, and the psychometric approach we have used.
Mapping techniques across studies
The mapping techniques used in our research (Ruiz-Primo et al., 1996; 1997; 1999; 2000) have been selected at different points of the directedness continuum (Figure 3). We have varied mapping task constraints across studies and, according to the task, the response formats and the scoring systems.
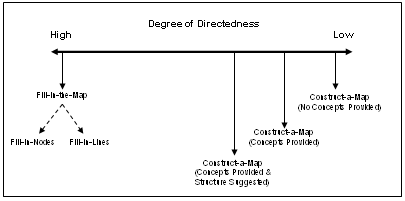
Figure 3. Concept map techniques studied according
to constraints of the mapping tasks
We have focused on both extremes of the continuum by studying, high- and low-directed techniques. We considered the low-directed technique, construct-a-map with nothing provided, as the "benchmark" technique for two reasons: (1) The structure of students’ maps could more directly reflect their knowledge structure. We posit that as the students' subject matter knowledge increases, the structure of students’ maps should increasingly reflect the structure of the domain as held by experts. By imposing a structure on the relations between concepts, it is difficult to know whether or not students' knowledge structures are becoming increasingly similar to experts'. And (2) asking students to generate the concepts to construct their maps provides a good piece of information about the student's knowledge in a particular domain (e.g., are the concepts selected by the student relevant/essential to the topic?). However, we considered that a complete openness in the task was undesirable in practice due to problems related with comparability and scoring. Therefore, we imposed some constraints to this technique on different studies. Characteristics and differences in this technique are described below as well as the other high-directed techniques we have studied.
Construct-a-map. In this technique students are asked to construct a map from scratch. This technique varies as to how much information is provided by the assessor (Figure 3). The assessor may provide the concepts and/or linking words or may ask students to construct a hierarchical or non-hierarchical map. The response format is simply a piece of paper on which students draw the map. Scoring systems vary from counting the number of nodes and linking lines to evaluating the accuracy of propositions.
As shown in Figure 3, we have examined different constraints in this technique. We have investigated three approaches. In one approach, students select some concepts they consider important/relevant in explaining a particular topic (e.g., ions, molecules, and compounds), construct the map with those concepts, and organize the terms in relation to one another in any way they want. No particular structure (e.g., hierarchical or any other kind) is required. In a second approach, students construct a map from scratch using the concepts provided by the assessor, and organize the terms in relation to one another in any way they want. Finally, in a third approach, students construct a map from scratch using the concepts provided by the assessor, organizing the terms in a particular way (i.e., in a hierarchical or non-hierarchical way). In the three mapping techniques, students are encouraged to use as many words as they want to label the lines between concepts.
Fill-in-the-map. Some researchers (e.g., Schau & Mattern, 1997) have argued that asking students to draw a map from scratch imposes too high a cognitive demand to produce a meaningful representation of their knowledge. They proposed an alternative technique, "fill-in-the-map". The fill-in-the-map technique provides students with a concept map where some of the concepts and/or the linking words have been left out. Students fill in the blank nodes or linking lines (e.g., Anderson & Huang, 1989; McClure & Bell, 1990; Schau, Mattern, Weber, Minnick, & Witt, 1997; Surber, 1984). The response format is straightforward; students fill in the blanks and their responses are scored correct-incorrect.
We have examined two types of fill-in-the-map techniques (Figure 4): (1) fill-in-the-nodes, in which students fill in a blank-node skeleton map with the concepts provided; and (2) fill-in-the-linking-lines, in which students fill in a blank-line skeleton map with a description of the relationship provided for each pair of connected concepts.
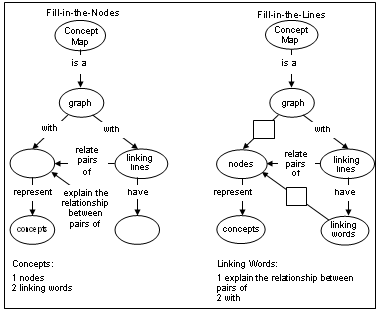
Figure 4. Examples of fill-in-the-nodes and fill-in-the-lines skeleton maps
Map scoring systems
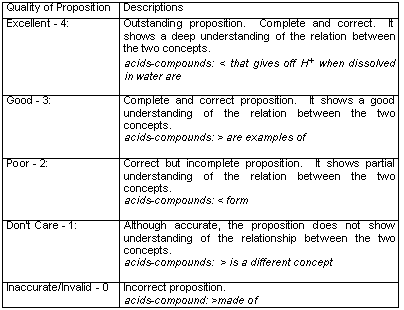
To find an efficient construct-a-map scoring system we have explored different types of scores; some based on the quality of the propositions, others using a criterion map, and still others using just a dichotomous score, correct and incorrect. The scores we have studied are: (1) proposition accuracy score--the total sum of the accuracy of each proposition in a student's map assessed on a five-point scale, (2) convergence score--the proportion of accurate propositions in the student's map out of the total possible valid propositions in the criterion map (expert’s map), and (3) salience score--the proportion of valid propositions out of all the propositions in the student's map.
To account for the variation in the quality of the proposition, we classified each map’s proposition into one of five categories: Accurate Excellent, Accurate Good, Accurate Poor, "Don't Care" and Inaccurate. Table 1 presents the definition of each category. For example, the accurate excellent proposition between acids and compounds should be read, according to the direction of the arrow (<), as follows: compounds that give off H+ when dissolved in water are acids. The maximum proposition accuracy score for a map constructed by students is based on a criterion map: the number of links in the criterion map is multiplied by 4 (all propositions are considered as excellent).
In developing a criterion map for scoring we assume that: (1) there is some "agreed-upon organization" that adequately reflects the structure of a content domain, (2) "experts" in that domain can agree on the structure, and (3) experts' concept maps provide a reasonable representation of the subject domain (e.g., Glaser, 1996). The goal in constructing a criterion map is to identify those propositions (nodes and links) considered to be "substantial" to the domain, and that students should know about a topic at a particular point.
Table 1. Quality of proposition categories
To determine the "substantial" links (propositions), teachers, experts, and ourselves, as researchers, have constructed concept maps. The teachers and the experts constructed their maps based on the concepts they considered important for a particular topic. Teachers' concept maps are expected to provide a benchmark for the "substantial" links students are expected to have after learning a unit/module/chapter and participating in class. The experts' concept maps provide the "substantial" links based on the structure of the discipline. Finally, the researchers’ map is thought to reflect the "substantial" links based on the analysis of the intended curriculum (e.g., the analysis of the text used to teach a topic). Figure 5 provides a brief description of the procedure followed to select the key-concepts and to define the criterion map.
The "agreed-upon" links across experts’, teachers', and researchers' maps are represented in a criterion map and they are considered to portray the "substantial" links that students are expected to know after instruction or at a particular point in time.
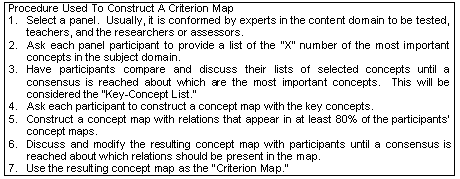
Figure 5. Procedure followed to define the Key-Concept List
and the Criterion Map (after Ruiz-Primo et al., 1999).
We have used the criterion maps as a master map for constructing the skeleton maps for the fill-in-the-map techniques. Concepts selected for the blank nodes on the skeleton maps are randomly sampled from the key-concept list. Linking lines selected to be filled-in on the skeleton maps are sampled from the linking lines on the criterion map. Propositions provided in the skeleton maps are also taken from the criterion map.
Training for constructing concept maps
A mini-training program was designed to teach students, teachers, and experts to construct concept maps. The training lasts about 50 minutes and has four major parts. The first part focuses on introducing concept maps: what they are, what they are used for, what their components are (i.e., nodes, links, linking words, propositions), and examples (outside the domain to be mapped) of hierarchical and non-hierarchical maps. The second part emphasizes the construction of concept maps. Four aspects of mapping are highlighted: identifying a relationship between a pair of concepts, creating a proposition, recognizing good maps, and redrawing a map. Students are then given two lists of common concepts to "collectively construct" a map. The first list focuses on the "water cycle"--a non-hierarchical map; the second list focuses on the "living things"--a hierarchical map. The third part of the program provides each individual with 9 concepts on the "food web," to construct a map individually. The fourth part of the program is a discussion of students' questions after they had constructed their individual maps. The program has proved to be effective in achieving this goal with more than 300 high school students. To evaluate effectiveness of the training, we have randomly sampled individually constructed maps at the end of the training within each group. These analyses have focused on three aspects of the maps: use of the concepts provided in the list, use of labeled links, and the accuracy of the propositions. Results across studies have indicated that: (a) more than 94 percent of the students used all the concepts provided in the list, (b) 100 percent used labeled lines, and (c) more than 96 percent provided one or more valid propositions. We have concluded that the training program has succeeded in training students to construct concept maps.
Psychometric approach
We have examined concept map scores within the context of Generalizability (G) Theory. G theory recognizes that multiple sources of error contribute to the unreliability of a measure and hence to the estimate of student performance (e.g., Cronbach, Gleser, Nanda, Rajaratnam, 1972; Shavelson, Webb, & Rowley, 1989). In contrast to classical test theory that evaluates an achievement-test score one facet a time (e.g., occassions), G theory evaluates the quality of a test score, taking other facets simultaneously. This allows pinpoint the source of the greatest measurement error (e.g., tasks, occasions, raters, or their interaction). Moreover, G theory provides an estimate of the reliability (generalizability) coefficient for two types of interpretations, relative and absolute. Relative interpretations focus on the task ordering of students, as is common in correlational analyses. Absolute interpretations focus on the level of performance in a domain without regard to the performance of others (e.g., Shavelson & Webb, 1991).
The sampling framework we have used in our research defines and integrates the following facets: mapping techniques, raters, and terms (i.e., concepts). G theory has been used to evaluate the generalizability of students’ average score map scores over mapping techniques, raters, and concepts. Different facets have been included in different studies; however, we have acknowledged that other facets, which we have not studied yet, can be included in the framework (e.g., occasions, method). Other procedures have been carried out for supporting score interpretations (e.g., cognitive analyses, comparison between experts and novices).
Evaluating the technical characteristics of concept maps
Most of the studies we have conducted involve repeated measures. Students are assessed across different mapping techniques and/or across the same mapping technique but with different samples of concepts. The former approach focuses on evaluating whether different mapping techniques provide a "similar" picture of students’ connected understanding (a validity issue). The latter, examines concept-sampling variability (a reliability issue). We found that little attention has been paid to this latter issue (e.g., Ruiz-Primo & Shavelson, 1996a). Hence, in our studies we have randomly sampled concepts whenever possible. In this section some of these studies are briefly described.
Study 1. We first examined the effect of providing/not providing concepts for constructing the map by varying the source of concepts sample, students or assessor (Ruiz-Primo, et al., 1996). Mapping Technique 1 asked students to provide 10 important concepts in a domain with which to construct the map and Mapping Technique 2 provided a set of 10 concepts. To test whether concept map scores were sensitive to the sampling of concepts, two different samples, A and B, from the same domain were used in Technique 2. The content domain selected for this study was Ions, Molecules and Compounds. Forty high school chemistry students, two teachers and one chemist (the expert) were trained to construct concept maps. All students first completed a multiple-choice test, then constructed a concept map with Technique 1, and finally, constructed two concept maps (both samples, A and B) with Technique 2. After constructing the map with Technique 1, half of the students used first Sample A and then Sample B, and the other half used the samples in the opposite order.
For two techniques to be considered equivalent, they should produce similar means and variances, as well as similar indices of reliability and validity. Here are some highlights of the findings in this study: (1) The repeated measures ANOVAs over the three conditions (No-Concepts--Technique 1, Sample A and Sample B--Technique 2) indicated that Techniques 1 and 2 were equivalent. No significant differences were found among means or variances over the three conditions for both, the proposition accuracy (Hotelling’s T = .05; p > .05; F; Mauchly’s W = .94, p = >.05) and salience scores (Hotelling’s T = .06; p > .05; F; Mauchly’s W = .90, p = >.05). Convergence score was not available for the "No Concepts" condition because no criterion could be established to determine the expected number of propositions. It is important to mention that we found that under the student-generated condition, some students provided related but no relevant/essential concepts to the topic. An irrelevant but related concept (e.g., "chemistry" within the topic of ions, molecules, and compounds) led students to provide many accurate but irrelevant relationships between concepts within the topic in which students were assessed (e.g., compounds "is a" concept in chemistry). This situation led to artificially high scores. When non-relevant concepts were dropped from students’ maps, a significant mean difference between mapping techniques was found. Furthermore, the student-generated sample technique (Technique 1) proved challenging when developing a scoring system since each concept map might have a unique set of concepts and relations.
(2) To examine the generalizability of proposition accuracy and salience scores across raters and conditions we carried out two person x rater x condition G studies. In both G studies, results showed that the largest variance component was for persons followed by the interaction of person by condition. Raters did not introduce error variability into the scores (the percent of score variability was negligible). Not surprisingly, students' relative standing varied from one condition to the next (some students did better with Sample A, others with Sample B, and still others when they selected the concepts to use in their maps). Both relative and absolute "reliability" coefficients were the same magnitude across types of scores and higher for the proposition accuracy score (.90), than for the salience score (.79). These results suggest that concept map scores can consistently rank students relative to one another as well as provide a good estimate of a student's level of performance, independently of how well their classmates performed.
(3) The generalizability of scores across raters and concept samples was examined in three, person x rater x concept-sample, G studies, one for each type of score. The pattern observed was the same across types of scores. In general, the largest variance component was for persons followed by the interaction of person by concept-sample; the percent of score variability for raters was negligible. The highest relative and absolute coefficients were for the proposition accuracy scores (.89 for both coefficients) and the lowest for the salience scores (.83 for the relative coefficient and .82 for the absolute coefficients). Furthermore, no significant differences in means or variances were found between samples in any type of score (i.e., proposition accuracy, convergence, and salience), nor a sequence effect was observed. We concluded that students’ map scores did not differ, on average, in Sample A and Sample B.
(4) Results obtained across all the analyses suggest that the type of score selected for grading concept maps might be an issue. Results from the person x rater x conditions G studies showed that the percent of variability among persons is higher for the proposition accuracy score (i.e., 73.47 percent) than for the salience score (i.e., 52.48 percent). Results for the person x rater x concept-sample G studies showed a similar pattern. The percent of score variability among persons was higher for the proposition accuracy scores (79.82 percent) and for the convergence scores (70.02 percent) than for the salience scores (67.08 percent). This indicates that proposition accuracy (PA) and convergence (CON) scores reflect better the differences in students' knowledge structure than salience (SAL) scores. Also, a multiscore-multitechnique matrix showed that salience scores may rank students differently depending on the technique used (e.g., Mapping Technique 1: rPA.SAL= .81, Mapping Technique 2: rPA.SAL= .89 on average across samples). The lowest correlation coefficients between types of scores across techniques were those involving salience scores.
(5) Correlations between multiple-choice tests and concept map scores across mapping techniques and types of scores were all positive and moderately high (r = .57 on average). We interpret these findings to mean that concept maps and multiple-choice tests measure overlapping and yet somewhat different aspects of declarative knowledge. Although correlations between multiple-choice and types of scores were not the same across techniques (e.g., correlations are lower in Technique 1 than correlations in Technique 2) differences were not significant (see Meng, Rosenthal, Rubin, 1992). The lowest correlations with the multiple-choice test were those with the salience scores.
Study 2. In another study, we compared other mapping techniques, construct-a-map (low-directed technique) and fill-in-the-map (high-directed technique; Ruiz-Primo et al., 1999). As in the previous study, the construct-a-map technique asked students to construct a 20-concept map from scratch (concepts provided by assessor). In the fill-in-the-map technique students were required to fill-in the blank-nodes skeleton map and the blank-linking lines skeleton maps. Furthermore, to examine the sensitivity of the fill-in-the-map scores to the variability of sampling blank-nodes or blank-linking lines, we randomly sampled the nodes and linking lines that needed to be filled in by the students, from the criterion map. Students (n = 152) were tested on three occasions: On occasion 1 students constructed-a-map from scratch. On occasion 2, students were asked to fill in the blank-nodes map; half the students filled the Sample A skeleton map (Map A) and the other half sample B skeleton map (Map B). On occasion 3, students were asked to fill-in the blank-linking lines map; as before, half students filled Sample A linking-line skeleton map (Map C), the other half the Sample B linking-line skeleton map (Map D). Students were randomly assigned within classrooms to the four sequences (i.e., Map A followed by Map C; Map A followed by Map D; Map B followed by Map C; and Map B followed by Map D). All students within a class received at the end a 30-item multiple-choice test developed by the teachers and researchers
(1) To determine whether the fill-in-the-map scores were sensitive to the sample of nodes (concepts) or linking-lines (propositions) left blank, we compared the mean and variances of scores between Skeleton Map A and B (blank nodes) and between Skeleton Map C and D (blank linking lines). The results indicated that fill-in-the-map scores were not sensitive to the sample of nodes (independent-samples t=1.57, p=.12) or linking lines (independent-samples t = 1.64, p = .10) to be filled in. The Levene test indicated that variances were not homogeneous across samples (Fnodes= 6.77 and Flinks= 2.16; p =.20). However, since the interquartile range across samples were the same or very similar (nodes: sample 1, IQR = 2.00 and sample 2, IQR = 2.00; linking lines: sample 1, IQR = 4.00, and sample 2, IQR = 6.00), we concluded that both samples of nodes and linking lines were equivalent and that students' scores were not affected by the particular sample used in the skeleton maps.
(2) A 2 x 4 (skeleton map type by sequence) split-plot ANOVA was carried out to evaluate whether the type of skeleton map (i.e., fill-in-the-node and fill-in-the-linking line) and the sequence (i.e., four sequences) affected map scores. The results indicated a significant interaction between type of skeleton map (T) and sequence (S;  =2.73, p = .046) and a significance difference for type of map (
 =65.95, p = .000); but no significant difference was observed for sequence (
 =.63, p = .599). A closer look into the interaction revealed that filling in the nodes of a map using sample B somehow facilitated the filling in the linking line map when sample A was used. However, a more important result was the significant mean differences between the two types of skeleton maps, fill-in-the-node and fill-in-the-line. An FMax test indicated that the score variances of the two types of maps were different (FMax = 3.35, p < .05). We concluded that fill-in-the-node and fill-in-the-linking line techniques could not be considered equivalent forms of fill-in-the-map. Fill-in-the-node maps were easier for students than fill-in-the-linking line maps.
Since the two samples of nodes and linking lines were considered equivalent, samples of nodes and linking lines were ignored and a pooled within sequence correlation between the fill-in-the-node and fill-in-the-linking line maps was calculated. The magnitude of the pooled correlation was .56, suggesting that students were ranked somewhat differently across the two types of maps.
(3) As in our previous study, we scored constructed maps using the three types of scores. Three raters scored one third of the students’ map sample and three person x raters G studies were carried out. The general conclusion was consistent with the previous study. Raters introduced a negligible error. Proposition accuracy and convergence scores reflected the differences in students' knowledge structure better than salience scores. Based on practical (e.g., scoring time) and technical (e.g., stability of scores) arguments, we concluded that the convergence score proved to be the most efficient. The internal consistency coefficients for the nodes-skeleton maps were .71 (averaged across both samples of nodes) and .85 (averaged across the two samples of linking lines).
(4) Finally, we evaluated the extent to which the scores on the two mapping techniques, fill-in-the-map and construct-a-map, converged. We used a correlational approach since we were dealing with different score scales. If the construct-a-map and fill-in techniques measure the same construct, we should expect a high correlation among these scores. Yet, correlations were lower than expected (r =.46 averaged across techniques), indicating that students were ranked differently according to the technique used. We concluded that different aspects of the students' connected understanding were being tapped with the different techniques. When means scores across the forms of assessments were compared, they did not provide the same picture about students' knowledge of the topic. Whereas mean scores obtained under the high-directed technique indicated that students' performance was close to the maximum possible, the scores obtained with the low-directed technique revealed that students’ knowledge was partial compared to a criterion map. We concluded that the construct-a-map technique better reflected differences among students' knowledge. The different pattern of correlations between scores from the multiple-choice test and mapping techniques confirmed that the mapping techniques were not equivalent.
Study 3. In the most recent study, we evaluated the validity of connected understanding interpretations of three concept-mapping techniques (Ruiz-Primo et al., 2000). To address cognitive validity, evidence is sought about the correspondence between intended task demands and the cognitive activity evoked, as well as the correspondence between the quality of cognitive activity and performance scores (Glaser & Baxter, 1997). We evaluated the validity of connected understanding interpretations of the three concept-mapping techniques described in Study 2. This study focused on providing evidence about the correspondence between intended task demands, inferred cognitive activity, and scores obtained for the three mapping techniques. We analyzed respondents’ concurrent and retrospective verbalizations at different levels of competency (i.e., teachers, high- and low-proficient students) in performing the mapping tasks and compared the directedness of the mapping tasks, the characteristics of verbalizations and the scores obtained across techniques. Six high-school students and two teachers were asked to think aloud (concurrent verbalization) as they were engaged in each of the three concept-mapping techniques. After they finished each assessment, they were asked to describe, retrospectively, the strategies used. Twenty-four verbal protocols were analyzed for this study. To evaluate the nature and quality of cognitive activities, a system that includes a set of coding categories (e.g., explanation, monitoring, conceptual errors) for classifying the content of the respondents’ verbal protocols was developed, as well as a system for displaying the planning (i.e., statements representing a sequence of possible steps to approach the task) and the strategies (i.e., the solution approaches used by students to work through the mapping tasks) used by the respondents to address the assessment tasks (Ruiz-Primo, et al., 2000).
We concluded that: (1) Inferred cognitive activities across assessment tasks differed and corresponded to the directedness of the assessment task (e.g., verbal units that reflected "explanations" were more frequent in the construct-a-map technique than in the fill-in-the-map techniques, and more conceptual errors were verbalized in the construct-a-map technique than in the fill-in-the-map techniques). The low-directed technique provided students with more opportunities to use their conceptual understanding than the high-directed techniques.
(2) As expected, we found cognitive activities related with explaining and conceptual errors to be associated with the level of performance displayed across mapping techniques. Teachers and high-proficient students verbalized more explanation but less conceptual errors than low-proficient students. Based on the differences in the pattern of "explanations" and "conceptual errors" across levels of proficiency groups, we concluded that the construct-a-map technique better tapped into differences in subjects’ cognitive activities according to their level of competence. However, in contrast to prior studies of expertise (e.g., Baxter, Elder, & Glaser, 1996), we found increased monitoring of performance to be associated with lower performance scores. We think that the characteristics of the assessment task interact somehow with the proficiency level and this interaction determines the frequency and the type of monitoring needed to perform the task.
(3) Although we expected teachers and high-proficient students to have "a plan" that provided procedures and outcomes for performing each mapping task, this was not the case. In contrast to the literature (e.g., Baxter, Elder, & Glaser, 1996), providing a plan was not a generalized characteristic of competent students in our study (e.g., only one teacher and one high-proficient student provided a plan in the construct-a-map technique). Both, high- and low-proficient students started the tasks without providing any justification or possible procedures or outcomes. We hypothesized that when the characteristics of the task do not lead to many different options for performing it, respondents do not see the need to formulate a plan or the possible outcomes. For example, in the fill-in-the-map techniques, the respondents who provided a plan referred only to the procedure to be used, not to the outcomes (e.g., "…I go to a blank node first and I look at the arrows that are connecting to it…"). Although no differences in planning were found across level of proficiency groups, we found that efficient strategies were a characteristic of the high-proficient students only.
(4) Evidence on the congruence among task directedness, inferred cognitive activities, and performance scores led us to conclude that the construct-a-map technique was the most cognitively valid technique, and that the fill-in-the-nodes technique was the least valid for assessing students’ connected understanding. However, the jury is still out on the fill-in-the-lines technique. Despite the evidence on the inferred cognitive activities, in this study scores produced by this technique correlated highly with the construct-a-map scores (.89). We concluded that the low-directed technique, construct-a-map, provided students with more opportunities to reveal their conceptual understanding than did the fill-in-the-nodes high-directed technique. Furthermore, the former better reflects the differences among students of different levels of competency.
General conclusions
There is a potential in using concept maps as assessment instruments, at least from the technical quality perspective. Nevertheless, there are still some issues that need to be solved before we can conclude that they can reliably and validly evaluate students' connected understanding, especially if concept maps are to be used in high stake accountability contexts (see for example, Lomask, Baron, Greig, & Harrison, 1992).
It is clear that we need to invest time and resources in finding out more about what aspects of students' knowledge are tapped by different forms of concept map assessments. Which technique(s) should be considered the most appropriate for large-scale assessment? Practical issues, though, cannot be the only criterion for selection. We have proved that constraints and affordances imposed by different forms of assessments affect the way students perform. This means that different mapping techniques may lead to different conclusions about students’ knowledge. Rice, Ryan, and Samson (1998) have suggested that even different methods of scoring maps within the same technique may be measuring different constructs of aspects of the domain.
Another issue that requires more information before anything can be concluded is the convergence between multiple-choice tests and concept map scores. Results across studies are not conclusive. Not surprisingly, the magnitude of the correlations vary according to the mapping technique. The magnitude of the correlations between fill-in-the-node and multiple-choice scores reported by Schau et al. (1997) were higher (.75 on average) than the one we found in our study 2 (.37 using convergence score). The magnitude of the correlations between the construct-a-map technique and multiple-choice scores reported by Novak, Gowing & Johansen (1983) were lower (correlations ranged from -.02 to .34) than the one we found in our studies (.55 averaged across studies and using convergence score). However, Rice, Ryan, and Samson (1998) found high correlations between students’ concept maps scores and their scores on multiple-choice tests.
Still, results across all the studies using the construct-a-map technique suggest the following good news about concept map scores: (1) Students can be trained to construct concept maps in a short period of time with limited practice. (2) Raters do not introduce error variability into the scores; then, it can be concluded that concept maps can be reliably scored even when complex judgments such as quality of proposition are required (the interrater reliability on convergence score averaged across studies is .96). (3) Sampling variability from one random sample of concepts to another provides equivalent map scores when the concept domain is carefully specified. It is possible that the procedure we have followed in selecting the concept domain helped to create a list of cohesive concepts, therefore, any combination of concepts could provide critical information about student’s knowledge about a topic. (4) The high magnitude of relative (.91) and absolute (.91) coefficients, averaged across types of scores and studies, suggest that concept maps scores can consistently rank students relative to one another and provide a good estimate of a student’s level of performance, independently of how well their classmates performed. (5) The convergence score –the proportion of valid propositions in the students’ map out of the possible propositions in the criterion map–seems to better reflect systematic differences in students’ connected understanding and it is the most effort and time efficient indicator.
With respect to the different mapping techniques we have found the following: (1) Construct-a-map with assessor-generated concepts is the technique that most accurately reflects student differences on connected understanding. (2) Construct-a-map and fill-in-the-nodes are not equivalent mapping techniques. (3) Neither are the fill-in-the-nodes and fill-in-the-linking-lines techniques. (4) Neither construct-a-map nor fill-in-the-map techniques are sensitive to the sample of concepts, blank nodes, or blank linking lines selected.
Many questions still remain to be studied. For example, how large a sample of concepts is needed to measure a student’s knowledge structure? How stable are concept maps scores? How exchangeable are concept mapping techniques that use different response modes (e.g., computer simulations versus paper-and-pencil). The research agenda in this area is long, but necessary, if we want to test the potential of concept maps as an instrument to measure a different aspect of achievement in a domain.
References
Anderson, R. C. (1984). Some reflections on the acquisition of knowledge. Educational Researcher, 13(10), 5-10.
Anderson, T. H. & Huang, S-C. C. (1989). On using concept maps to assess the comprehension effects of reading expository text (Technical Report No. 483). Urbana-Champaign: Center for the Studying of Reading, University of Illinois at Urbana-Champaign. (ERIC Document Reproduction Service No. ED 310 368).
Baxter, G.P., Elder, A.D., & Glaser, R. (1996). Knowledge-based cognition and performance assessment in the science classroom. Educational Psychologist, 31(2), 133-140.
Chi, M.T.H., Feltovich, P.J., & Glaser, R. (1981). Categorization and representation of physics problems by experts and novices. Cognitive Science, 5, 121-152.
Chi, M.T.H., Glaser, R., & Farr, M.J. (1988). The nature of expertise. Hillsdale, NJ: Lawrence Earlbaum Associates, Publishers.
Cronbach, L. J. (1990). Essentials of psychological testing (Fifth ed.). New York: Harper & Row Publishers.
Cronbach, L.J., Gleser, G.C., Nanda, H., & Rajaratnam, N. (1972). The dependability of behavioral measurements. New York: John Wiley.
Dochy, F. J. R. C. (1996). Assessment of domain-specific and domain-transcending prior knowledge: Entry assessment and the use of profile analysis. In M. Birenbaum & F. J. R. C. Dochy (Eds.) Alternatives in assessment of achievements, learning process and prior knowledge (pp. 93-129). Boston, MA: Kluwer Academic Publishers.
Glaser, R. (1996). Changing the agency for learning: Acquiring expert performance. In K. A. Ericsson (Ed.) The road to excellence: The acquisition of expert performance in the art, sciences, sports, and games (pp 303-311). Mahwah, NJ: Erlbaum.
Glaser, R. & Bassok, M. (1989). Learning theory and the study of instruction. Annual Review of Psychology, 40, 631-66.
Glaser, R. & Baxter, G.P. (1997). Improving the theory and practice of achievement testing. Paper presented at the BOTA Meeting. National Academy of Science/National Research Council. Washington, DC.
Goldsmith, T. E., Johnson, P. J., & Acton, W. H. (1991). Assessing structural knowledge. Journal of Educational Psychology, 83(1), 88-96.
Lomask, M., Baron, J. B., Greig, J. & Harrison, C. (1992, March). ConnMap: Connecticut's use of concept mapping to assess the structure of students' knowledge of science. Paper presented at the annual meeting of the National Association of Research in Science Teaching. Cambridge, MA.
McClure, J. R., & Bell, P. E. (1990). Effects of an environmental education-related STS approach instruction on cognitive structures of preservice science teachers. Pennsylvania, PA: Pennsylvania State University. (ERIC Document Reproduction Service No. ED 341 582).
Meng, X. L., Rosenthal, R. & Rubin, D. B. (1992). Comparing correlated correlation coefficients. Psychological Bulletin, 111(1), 172-175.
Mintzes, J.J., Wandersee, J.H., & Novak, J.D. (1997). Teaching science for understanding. San Diego: Academic Press.
Novak, J. D., & Gowin, D. R. (1984). Learning how to learn. New York: Cambridge Press.
Novak, J. D., Gowin, D. B., & Johansen, G. T. (1983). The use of concept mapping and knowledge vee mapping with junior high school science students. Science Education, 67(5), 625-645.
Pearsall, N.R., Skipper, J.E.J., & Mintzes, J.J. (1997). Knowledge restructuring in the life sciences. A longitudinal study of conceptual change in biology. Science Education, 81(2), 193-215.
Rice, D.C., Ryan, J.M. & Samson, S.M. (1998). Using concept maps to assess student learning in the science classroom: Must different method compete? Journal of Research in Science Teaching, 35(10), 503-534.
Ruiz-Primo, M. A. & Shavelson, R. J. (1996a). Problems and issues in the use of concept maps in science assessment. Journal of Research in Science Teaching, 33(6), 569-600.
Ruiz-Primo, M. A. & Shavelson, R. J. (1996b). Rhetoric and reality in science performance assessment. Journal of Research in Science Teaching, 33(10), 1045-1063.
Ruiz-Primo, M.A., Schultz, E. S., & Shavelson, R.J. (1996, April). Concept map-based assessments in science: An exploratory study. Paper presented at the annual meeting of the American Educational Research Association, New York, NY.
Ruiz-Primo, M.A., Schultz, E. S., & Shavelson, R.J. (1997, March). On the validity of concept map-based assessment interpretations: An experiment testing the assumption of hierarchical concept maps in science. Paper presented at the annual meeting of the American Educational Research Association, Chicago, IL.
Ruiz-Primo, M.A., Schultz, E. S., Li, M., & Shavelson, R.J. (1999). Comparison of the Reliability and Validity of Scores From Two Concept-Mapping Techniques. Manuscript submitted for publication.
Ruiz-Primo, M.A., Shavelson, R.J., Li, M., & Schultz, E. S. (2000). On the validity of cognitive interpretations of scores from alternative concept-mapping techniques. Manuscript submitted for publication.
Schau, C., & Mattern, N. (1997). Use of map techniques in teaching applied statistics courses. The American Statistician, 51, 171-175.
Schau, C., Mattern, N., Weber, R., Minnick, K., & Witt, C. (1997, March). Use of fill-in concept maps to assess middle school students' connected understanding of science. Paper presented at the AERA Annual Meeting, Chicago, IL.
Shavelson R. J. (1972). Some aspects of the correspondence between content structure and cognitive structure in physics instruction. Journal of Educational Psychology, 63, 225-234.
Shavelson, R.J., & Ruiz-Primo, M.A. (1999). Leistungsbewertung im naturwissenschaftlichen Unterricht (On the assessment of science achievement). Unterrichtswissenschaft. Zeitschrift für Lernforschung, 27 (2), 102-127.
Shavelson, R.J., & Ruiz-Primo, M.A., (2000). On the psychometrics of assessing science understanding. In J. Mintzes, J. Wandersee, J. Novak (Eds). Assessing science understanding (pp. 303-341). San Diego: Academic Press
Shavelson, R. J. & Webb, N.M. (1991). Generalizability theory: A primer. Newbury Park, CA: Sage.
Shavelson, R.J., Webb, N.M., & Rowley, G. (1989). Generalizability theory. American Psychologist, 44(6), 922-932.
Surber, J.R. (1984). Mapping as a testing and diagnostic device. In C.D. Holley & D.F. Dansereau (Eds.). Spatial learning strategies: techniques, applications, and related issues (pp. 213-233). Orlando: Academic Pres
White, R. T, & Gunstone, R. (1992). Probing understanding. New York: Falmer Press.
Zajchowski, R. & Martin, J. (1993). Differences in the problem solving of stronger and weaker novices in physics: Knowledge, strategies, or knowledge structure. Journal of Research in Science Teaching, 30(5), 459-470.
Please cite the source as:
Ruíz-Primo, M. (2000). On the use of concept maps as an assessment tool in science: What we have learned so far. Revista Electrónica de Investigación Educativa, 2 (1). Retrieved month day, year from: http://redie.uabc.mx/vol2no1/contenido-ruizpri.html