Revista Electrónica de Investigación Educativa
Vol. 2, No. 1, 2000
The Level of Difficulty and Discrimination Power
of the Basic Knowledge and Skills
Examination (EXHCOBA)
Eduardo Backhoff Escudero
(*)
backhoff@uabc.edu.mx
Norma Larrazolo Reyna
(*)
normal@uabc.mx
Martín Rosas Morales
(*)
maromo@uabc.mx
*
Instituto de Investigación y Desarrollo Educativo
Universidad Autónoma de Baja California
A.P. 453
C.P. 22830
Ensenada, Baja California, México
(Received: February 28, 2000;
accepted for publishing: March 28, 2000)
Abstract
The Basic Knowledge and Skills Examination (EXHCOBA) is one of the few great-scale examinations in Mexico which has been publishing its psychometric parameters. In this paper we describe the item analysis results, regarding the exam’s difficulty level and discrimination power. Results show that most of the items have a medium difficulty and a high discrimination power. They also reveal that the mathematics items have better discrimination power levels than the ones which belong to social science.
Key words: Admission tests, archievement tests, pychometric standars, higher education.
Introduction
Educational evaluation is a process which involves the production, application and analysis of instruments of educational measurement. The principle function of an instrument of educational measurement, when the instrument is created as a means of inferring people’s capacities, is to offer information on which to base the making of correct decisions.
When large-scale, high-stakes instruments are used, e.g. the case of admission examinations, it is necessary to know the technical indicators which define the quality of the educational instrument employed. Large-scale examinations are those designed for application in more than one school group, usually in a state, region or country. Because of its dimension and because of its powerful social impact, its design must be adjusted to rigorous quality standards (Aiken, 1996).
In 1985, the American Psychology Association (APA), in collaboration with the American Educational Research Association (AERA) and the National Council for Measurement in Education (NCME), published the manual Standards for educational and psychological tests, a document that emphasizes the importance of taking into account the welfare of those who take a test, and of avoiding the misuse of evaluation instruments. Following these codes helps to assure that the psychometric instruments are applied, graded and interpreted by suitably sensitive persons.
While in countries like the United States compliance with these criteria is mandatory, in Mexicali such a standard is nonexistent.
On the other hand, the institutions of higher learning (IES), having limited space as to the number of students they can accept, should be primarily interested in using these admission examinations for the selection of those students with the greatest potential for professional studies and academic achievement. However, until a short while ago, it was a common practice of the Mexican IES in selecting students (when enrollment was full) to use informal admission examinations prepared by groups of teachers who gave classes in each institution. This, whether or not the teachers were specialists in the matter. Because of a lack of knowledge, these examinations were neither adjudicated, validated nor standardized. Exceptions were some private IES (and recently some public ones) that used the Academic Aptitude Test (PAA), a Puerto Rican version of the Scholastic Aptitude Test (SAT) developed by the College Board of the United States of North America.
This national scenario has changed recently, with the appearance of the National Center for the Evaluation of Higher Education (CENEVAL), created in 1994 for the purpose of preparing and administering entrance examinations for secondary and upper-level educational institutions. In like manner, other institutions have expended much labor toward the preparation of a valid entrance examination; such are the cases of the Autonomous University of Baja California (UABC), the National Autonomous University of Mexico (UNAM) and the Autonomous Metropolitan University (UAM), to mention just a few. However, Mexico still lags behind in educational evaluation; this is evidenced by (1) the absence of national or regional quality-control organizations to establishing testing norms; (2) the lack of high-quality, large-scale tests developed, standardized and validated in our country; and (3) the paucity of publications carrying the psychometric indicators contained in the small number of large-scale tests developed in Mexico.
An exception to the rule is the Basic Knowledge and Skills Examination (EXHCOBA), developed in 1992 by a group of UABC and UNAM researchers, to provide and instrument for selecting the best of the students trying every possible way to get into the UABC as well as other institutions of higher learning in the country (Backhoff and Tirado, 1992).
From its inception, the EXHCOBA has been accumulating evidence regarding the different indicators that sustain its technical quality. Various magazines have published some of this evidence, such as a description of the content (Backhoff and Tirado, op. cit.; 1993; 1994); standardization (Larranzolo, 1997a and 1997b); predictive and concurrent validity (Tirado, Backhoff, Larranzolo and Rosas, 1997); and comparative date (Backhoff and Tirado, 1993; 1994; and Backhoff, Tirado, Larranzolo and Antillón, 1997). Other indicators have been published in technical reports, or are in process at the moment, as part of postgraduate thesis projects.
However, there are still studies which have neither been carried out nor published. These have to do with validity of content; validity of construction; lack of bias; reliability; and the analysis of items. Three indicators are used for describing the psychometric characteristics of the items on an objective test: quality level, discrimination power and distracters effect.
The purpose of this study is to communicate the results of the psychometric indicators of the EXHCOBA’s items –e.g., those results having to do with the items’ difficulty level and discrimination power. This paper excludes the effect of distracters, because the subject is too extensive to deal with here.
To achieve our objective, we will first describe what specialized technical literature understands as the difficulty and discrimination of an item, as well as how these qualities are calculated. Then we will describe the methodology employed in our study and the results obtained, in order to facilitate a discussion of the results.
Item analysis
Difficulty. The difficulty of an item is understood as the proportion of the persons who answer a test item correctly. The higher this proportion, the lower the difficulty. What this means is that it has to do with an inverse relationship: the greater the difficulty of an item, the lower its index (Wood, 1960). To calculate the difficulty of an item, the number of persons who answered it correctly is divided by the total number of the persons who answered it. Usually this proportion is indicated by the letter p, which indicates the difficulty of the item (Crocker and Algina, 1986). It is calculated by the following formula:
 .............................................................(1)
where:
pi = Difficulty index of item i
Ai = Number of correct answers to item i
Ni = Number of correct answers plus number of incorrect answers to
item i
According to the EXHCOBA manual, the median difficulty level of the examination should range between 0.5 and 0.6, the values of p being distributed in the following manner: easy items, 5%; items of medium-low difficulty, 20%; items of medium difficulty, 50%; medium-hard items, 20%; and difficult items, 5%.
Discrimination. If the test and an item measure the same ability or competence, we would expect that those having a high overall test score would have a high probability of being able to answer the item. We would also expect the opposite, which is to say that those having low test scores would have a low probability of answering the item correctly. Thus, a good item should discriminate between those who score high on the test and those who score low.
Usually two ways of determining the discriminative power of an item are use: the discrimination index and the discrimination coefficient. Although there are various similar ways of calculating the discrimination index, in this work we will use the following formula:
................................................... (2)
| Di = |
Discrimination index of item i |
| GAcorrect answers = |
Number of correct answers to item i among the 27% of those with highest test scores. |
| GBcorrect answers = |
Number of correct answers to item i among the 27% of those with lowest test scores. |
| Nlargest group = |
Number of person in the largest group (GA or GB) |
The higher the discrimination index, the better the item can determine the difference between those with high test scores and those with low ones. If all the persons of GA answer an item correctly, and all the persons of BG answer incorrectly, then D = 1 (the maximum value of this indicator), if this doesn't hapen then D = -1 (the maximun negative value), if both groups answer the same, D = 0 (the minimum value of discrimination).
Ebel and Frisbie (1986) give us the following rule of thumb for determining the quality of the items, in terms of the discrimination index. Table I shows the values D and their corresponding interpretation. The recommendations for each of these values is shown in the table as well.
Table I. Discrimination power of the answers according to their D value
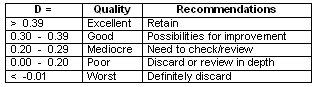
Two further indicators of the discriminative efficacy of an item are the point of biserial correlation and the coefficient of biserial correlation, which are called discrimination coefficients. The advantage of using the discrimination coefficient instead of the discrimination index (D) is that with the first method each and every person evaluated is taken into account, while with the second, only 54% of the total number of persons (the 27% highest and the 27% lowest) are considered.
The coefficient of biserial correlation (rbis) us calculated to determine the degree to which the competencies measured by the test are also measured by the item. The rbis gives an estimate of the product-moment correlation of the item, when this is dichotomized in answers correct and incorrect (Henrysson, 1971). The correlation of the biserial point (rpbis) is used to find out whether the “suitable” persons are those that get the most answers right, how much predictive power the item has, and how it can contribute to the predictions. Henrysson (1971) suggest that the rpbis tells us more about the predictive validity of the test than the coefficient of biserial correlation, since that tends to favor the items of medium difficulty. He also suggests that the rpbis is a measurement which combines the relationship between the criterion of the item and the difficulty level.
Ebel and Frisbie (1986) affirm that the rpbis simply describes the relationship between the answers to an item (0 or 1) and the test scores of all the persons. The equation for obtaining this indicator, according to Glass and Stanley (1986), is the following.
where: 
............................................(3)
| x1 = |
Median of the total scores of those who answered an item correctly. |
| Xo = |
Median of the total scores of those who answered an item incorrectly. |
| SX = |
Standard deviation of the total scores. |
| n1 = |
Number of those who answered an item correctly. |
| N0 = |
Number of those who answered an item incorrectly. |
| n = |
n1 + n0 |
Method
Instruments. The EXHCOBA is a normative multiple choice examination, designed to select the best aspirants of those who want to enter the upper level (although it may also be used for the median level by making certain adjustments). Some of the important characteristics of the design of this study are the following:
The examination is composted of three sections: basic abilities (with two theme areas and 60 items), basic knowledge (with four theme areas and 70 items) and basic knowledge of a specialty area (with nine theme areas and 180 items). The structure of the examination is given in Table II. The first corresponds to the elementary school level; the second, to junior high school; and the third, to high school.
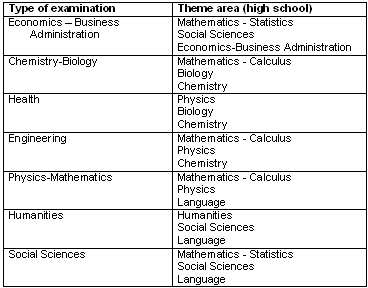
All the students answer the first two sections of the examination, which has a total of 130 items, and only answer 60 items from the third sections; in other words, three theme areas that are selected according to the field of study they want to enter. Within the theme areas of this third section of the examination, there are configured seven different types of examinations which correspond to the areas of knowledge used by AUNIES. Tale III shows the configuration of these for the field of study offered by the UABC.
In addition, there are five clone versions for each one of the 310 items on the examination. In this study only one of them (version two) is used.
Table II. Structure of the EXHCOBA
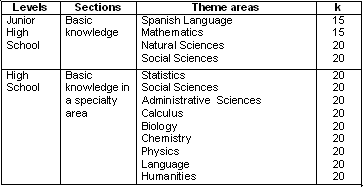
Table III. Theme areas of the section of basic knowledge of a specialty area
evaluated according to the type of examination
The examination may be administered in two ways: with paper and pencil, and by computer. In this study the computerized format was used. This format implies that the items and answer options are presented to the student on the screen of a computer terminal (one item at a time). Independently of the knowledge and practice s/he has regarding the use of computers, any student can do the examination without having this condition diminish the results. A more detailed description of the interface, and of its equivalence with the pencil/paper format is found published in several works (see, for example, Backhoff, Ibarra and Rosas, 1995).
Population. In the summer of 1998, 876 aspirants desiring to enter the UABC participated in this study. They represented a tenth of the total number of students who took the EXHCOBA hoping to be selected for the various university majors the institution offers. The group studied was randomly selected from among those students whose examination slip carried the number two as the final digit.
Procedure. The steps followed in administering and grading the examination were the same ones used by the university in its admissions process: (1) the student paid and obtained an examination slip, on which the date, place and hour of his/her examination was indicated; (2) according to the field of study s/he wished to enter, the automated system presented him/her with one of the seven types of examinations, according to the areas of knowledge into which the UABC’s majors are grouped; (3) the student took the examination without any kind of help (calculators, dictionaries, etc.), except paper and pencil; and (4) the system graded the answers automatically, giving the student a written report of his/her performance. During this process, a qualified person was always present to deal with any problem or item about how to manage the computerized part of the examination.
At the students were finishing the examination the results were put into a data base. This was later prepared to carry out the corresponding statistical analyses. Basically, the preparation consisted in changing the students’ raw scores into a binary format (0 and 1), so as to purge the cases with abnormal answer patterns (e.g. empty registers). Using the program Excel and the statistics package SPSS, the values p (difficulty), D (discrimination index) and rpbis for all the examination items were calculated.
The index of difficulty was calculated with equation (1), the discrimination index with equation (2), and the discrimination coefficient with equation (3).
Results
Table IV presents the averages of the medians and standard deviations of the values p, D and rpbis of the items of the 15 theme areas of the examination. Here was can observe that the general average difficulty of the EXHCOBA’s items was 0.56, with a standard deviation of 0.18, for the 876 students of this study.
By analyzing the difficulty levels according to the general themes and their location in the three scholastic levels, we can demonstrate that the average values of p, for the section of basic abilities (elementary school) was 0.65; for the section of basic knowledge (junior high school), it was 0.57; and for the section of basic knowledge of a specialty area (high school), it was 0.54. These values coincide with the scholastic levels they represent.
Table IV. Medians and standard deviations of the difficulty index (p),
discrimination index (D) and discrimination coefficient (rpbis)
by theme area of the EXHCOBA
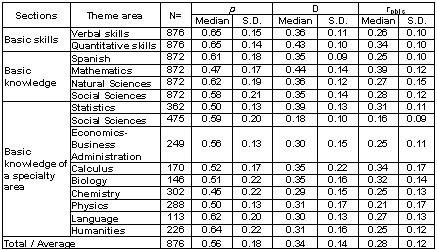
By comparing the 15 theme areas of the examination, we can see that its difficulty ranges from 0.45 to 0.65, and that the easiest are those related with verbal and quantitative abilities, as well as humanities; and that the most difficult were those related with natural sciences on a high-school level (chemistry, physics and biology), as well as the three areas of mathematics (mathematics, calculus and statistics). However, we must make it clear that not all the students answered the same theme areas of the section of basic knowledge of a specialty area (see Table III), so that although this comparison is not exact, it is closely approximate.
Next, in order to analyze the behavior of the 310 items as regarding difficulty, we present Figure 1, which shows the distribution of the frequencies of the values p. Here we can see that: (1) a great number of items are grouped in the frequency with a median of 0.65, (2) the distribution of these values has a negative bias, and (3) there is a slightly greater number of difficult items than easy ones.
Classifying the items according to their difficulty level, we can group them together in the following manner: 11.6% of very difficult (p < 0.32); 14.2% moderately difficult (from 0.33 to 0.52); 45.2% of medium difficulty (from 0.53 to 0.73); 14.2% moderately easy (from 0.74 to 0.86); and 4.8% very easy (p > 0.86).
On the other hand, regarding the discriminative power (D), we can see in Table IV that the average discrimination index for the whole examination is 0.34, while the average discrimination coefficient is 0.28.
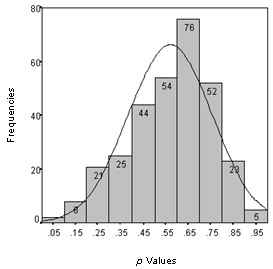
Figure 1. Items difficulty distribution of the EXHCOBA
By analyzing the discrimination indices (D) according to their general themes, we can show that the average values of D, for the section of basic abilities (elementary school) was 0.40; for the section of basic knowledge (junior high school) it was 0.31; and for the section of basic knowledge of a specialty area (high school) it was 0.31. In the same way, we find that the values of the discrimination coefficients (rpbis) for the sections of basic knowledge and abilities was 0.30, while for the section of basic knowledge of a specialty area, it was 0.26.
Since this test if for higher level education, it is interesting to not that the items that best discriminate are those related with the abilities acquired in elementary school; followed by the basic knowledge acquired in junior high school; and last, knowledge acquired in high school; an argument which strengthens the EXHCOBA’s central idea of evaluating basic competencies acquired throughout the scholastic life.
Figure 2. Discrimination indices and coefficients of the
15 theme areas of the EXHCOBA
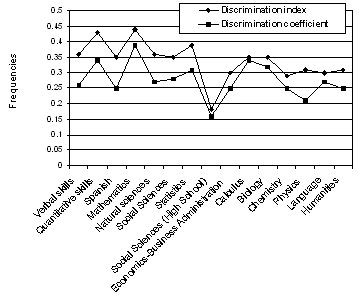
Analysis of the discrimination indices of the 15 theme areas of the examination shows that these range from 0.18 to 0.44, while the discrimination coefficients range from 0.16 to 0.39. In Figure 2 we can appreciate the discriminative behavior of the theme areas of the EXHCOBA with these two indicators. As we can see, there is a parallel between these two medians of discrimination, and the D values (discrimination indices) average 0.5 points higher than the rpbis values (discrimination coefficients).
Using the D values, we can assemble the theme areas, according to their discriminative power, into three groups: two areas with items having excellent discriminative power, with values greater than 0.40 (mathematics and quantitative abilities); one area whose items are deficient in discriminative power, with values lower than 0.20 (social sciences, on a high school level); and 12 areas with good discriminative power, with values between 0.29 and 0.39 (the remaining areas). In the same way, with the rpbis values we can group the theme areas in the following way: four areas with items having excellent discriminative power, with values greater than 0.30 (quantitative abilities, mathematics, calculus and biology); one area having weak discriminative power, with a value of les than 0.20 (social sciences, high school level); and 10 areas with good discriminative power (the remaining areas).
It is interesting to note that the area of knowledge with the best discriminative power is mathematics, and the area with the least discriminative power, is social sciences.
To demonstrate the behavior of the items according to their discriminative power, we present Figures 3 and 4, which show the distribution of the frequencies of the values D and rpbis respectively. Here it may be seen that the major part of the D values are grouping in the range of from 0.30 to 0.50, and that there are three items which discriminate negatively. The majority of the rpbis values are grouped in the intervals from 0.20 to 0.40, and seven items with negative discrimination are identified.
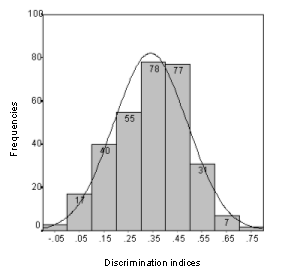
Figure 3. Discrimination indices distribution of the EXHCOBA
According to the information presented in Figures 2, 3, and 4, we can classify the items of the EXHCOBA according to their:
Difficulty levels that permit grouping them in the following way: 31 (10%) are very difficult (p < 0.3); 69 (22.2%) are moderately difficult (p = 0.31 - 0.50); 130 (42%) are of medium difficulty (p = 0.51 - 0.70); 75 (24.2%) are moderately easy (p = 0.71 - 0.90); and 5 (1.5%) are very easy (p * 0. 80).
Discussion
One basic was of finding out the quality of the items on a test is to try them out and analyze their behavior empirically. Two fundamental indicators for making this analysis are the difficulty level and the discrimination power.
Regarding the first, we can say that difficulty level of the EXHCOBA’s item is slightly higher than the difficulty level expected for a normative multiple-choice test with four answer options (0.62). Similarly, the distribution of the difficulty of its items comes very close to what is desirable, covering practically the whole gamut of p values, and concentrating 42% of its items at a value of medium difficulty. However, there is a slightly greater proportion of difficult items and moderately difficult ones than easy and moderately easy ones (approximately 5%). Last, it is important to point out that only 12% of the items presented inappropriate difficulty levels (too easy or too difficult), a value very close to the 10% theoretically expected.
As to the examination’s discrimination index, it can be said that 81% of its items presented acceptable to optimal levels; 18% of them had a poor level, and 1% discriminated negatively. Regarding the discrimination coefficients, 83% of its items presented acceptable or optimal levels; 14.5% had a poor level, and 2.5 discriminated negatively. As may be appreciated, with these two indicators of discriminative power equal results were obtained. This is shown clearly in Figure 2.
The items with greatest discriminative power were definitely those related with mathematics; inversely, those more deficient in discriminative power were those related to the social sciences. The preceding can be explained if we consider that mathematics evaluate competencies which have a close logical and inclusive relationship; in other words, their fundamental concepts are interlaced and are constructed one upon another, in progressive form, in such a way that it is impossible to understand a particular concept or solve a particular problem without understanding those that have gone before. For example, in order to carry out division, it is necessary to master addition, subtraction and multiplication. In contrast, the social disciplines are constructed without this close relationship between their basic concepts.
Finally, it is interesting to point out that the theme areas with the best discriminative power are concentrated in the first two sections of the examination, and that they evaluate competencies which are acquired in elementary school and junior high school. This also has a logical explanation, in the sense that these two sections evaluate very basic knowledge, necessary for understanding other, more complex ideas, and that these two sections are answered by all the students. This last aspect makes for a greater diversity in the competencies of the student body, which will make discrimination easier.
Based on all the foregoing, it is important to point out that these results, in addition to serving to improve the quality of the items, strengthen one of the central ideas of the EXHCOBA: the evaluation of basic abilities and knowledge acquired throughout the whole scholastic life. By using them it is possible to discriminate, and so select the best out of all the students who want to enter the university.
Translator: Lessie Evona York Weatherman
School of Languages
Autonomous University of Baja California at Mexicali
References
Aiken, L. R. (1996). Tests psicológicos y evaluación. México: Prentice Hall Hispanoamericana.
Backhoff, E., Ibarra, M. A., & Rosas, M. (1995). Sistema computarizado de exámenes (SICODEX). Revista Mexicana de Psicología,10 (1), 55-62.
Backhoff, E. & Tirado, F. (1994). Estructura y lógica del Examen de Habilidades y Conocimientos Básicos. Revista Sonorense de Psicología, 8 (1), 21-33.
Backhoff, E. & Tirado, F. (1993). Habilidades y conocimientos básicos del estudiante universitario: hacia los estándares nacionales. Revista de la Educación Superior, 88, 45-65.
Backhoff, E. & Tirado, F. (1992). Desarrollo del Examen de Habilidades y Conocimientos Básicos. Revista de la Educación Superior, 83, 95-117.
Backhoff, E., Tirado, F. Larrazolo, N., & Antillón, L. (1997). Desigualdad de la educación básica en México. Revista Latinoamericana de Estudios Educativos, 26 (3), 73-87.
CENEVAL. (s/f). Acerca del CENEVAL y los exámenes generales para el egreso de la licenciatura. México: author.
Crocker, L. & Algina, J. (1986). Introduction to classical and modern test theory. New York: Holt, Rinehart and Winston.
Ebel, R. L. & Frisbie, D. A. (1986). Essentials of education measurement. Englewood Cliffs, NJ: Prentice Hall.
Glass, G. & Stanley, J. (1986). Métodos estadísticos aplicados a las ciencias sociales. (E. Galvis & E. Guzmán, Trans.). México: Prentice-Hall Hispanoamericana.
Henrysson, S. (1971). Gathering, analysing, and using data on test items. In R. L. Thorndike (Ed.), Educational measurement. Washington, DC: American Council on Education.
Larrazolo, N. (1997a). Escala de calificaciones del Examen de Habilidades y Conocimientos Básicos. Mimeographed manuscript, Universidad Autónoma de Baja California.
Larrazolo, N. (1997b). Guía oficial de estudio. Mimeographed manuscript, Universidad Autónoma de Baja California.
Tirado, F., Backhoff, E., Larrazolo, N. & Rosas, M, (1997). Validez predictiva del Examen de Habilidades y Conocimientos Básicos (EXHCOBA). Revista Mexicana de Investigación Educativa. 11, (3), 67-84.
Wood, D. A. (1960). Test construction: Development and interpretation of achievement tests. Columbus, OH: Charles E. Merrill Books.
You can find information related to this article on the Web sites of:
Evaluation Assistance Center-Western Region (EAC West). (1996). Testing and test scores: Background and definitions.
http://www.ncbe.gwu.edu/mispubs/eacwest/handouts/testing/backgrnd.htm
(Retrieved January 22, 1999)
Kitao, S. K. & Kitao, K. (1997). Writing a good test.
http://www.ling.lancs.ac.uk/staff/visitors/kenji/kitao/design2.htm
(Retrieved January 20, 1999)
Please cite the source as:
Backhoff, E., Larrazolo, N. & Rosas, M. (2000). The level of difficulty and discrimination power of the Basic Knowledge and Skills Examination (EXHCOBA). Revista Electrónica de Investigación Educativa, 2 (1). Retrieved month day, year from: http://redie.uabc.mx/vol2no1/contents-backhoff.html