Revista Electrónica de Investigación Educativa
Vol. 7, No. 1, 2005
Quantitative Analysis of Complex Multiple-Choice
Items in Science Technology and
Society: Item Scaling
Ángel Vázquez Alonso
angel.vazquez@uib.es
Facultad de Ciencias de la Educación
Universidad de las Islas Baleares
Edificio Guillem Cifre de Colonya,
Carretera de Valldemossa, Km. 7.5, 07122
Palma de Mallorca, España
María Antonia Manassero Mas
ma.manassero@uib.es
Departamento de Psicología
Universidad de las Islas Baleares
Edificio Guillem Cifre de Colonya,
Carretera de Valldemossa, Km. 7.5, 07122
Palma de Mallorca, España
José Antonio Acevedo Díaz
ja_acevedo@vodafone.es
Inspección educativa
Consejería de Educación de la Junta de Andalucía
C/ Los Mozárabes 8, 3ª planta
21071, Huelva, España
(Received: January 14, 2005;
accepted for publishing: February 25, 2005)
Abstract
The scarce attention to assessment and evaluation in science education research has been especially harmful for Science-Technology-Society (STS) education, due to the dialectic, tentative, value-laden, and controversial nature of most STS topics. To overcome the methodological pitfalls of the STS assessment instruments used in the past, an empirically developed instrument (VOSTS, Views on Science-Technology-Society) have been suggested. Some methodological proposals, namely the multiple response models and the computing of a global attitudinal index, were suggested to improve the item implementation. The final step of these methodological proposals requires the categorization of STS statements. This paper describes the process of categorization through a scaling procedure ruled by a panel of experts, acting as judges, according to the body of knowledge from history, epistemology, and sociology of science. The statement categorization allows for the sound foundation of STS items, which is useful in educational assessment and science education research, and may also increase teachers’ self-confidence in the development of the STS curriculum for science classrooms.
Key words: Science Technology Society (STS), evaluation, opinion survey, item scaling.
Introduction: the need to assess STS issues
Many science education scholars and curricula designers agree about the need for innovating school science through STS issues, which has been translated into the reforms of several countries (Solomon & Aikenhead, 1994). However, one major hindrance to school science innovation through STS is the difficulty in assessing these issues. The assessment of STS contents can become an important curricular obstacle when teachers decide to implement STS education, since few teachers are willing to include these new topics in their lessons without having a clear idea of how to assess them (Bell, Lederman & Abd-El-Khalick, 2000).
General learning assessment has received scarce attention in science education research with scarce exceptions (Kempa, 1986). For example, the section devoted to evaluation in the International Handbook of Science Education (Fraser & Tobin, 1998) is shorter than other sections; in addition, the first line of the first paper on evaluation states “This Handbook section on assessment and evaluation could not have been written ten years ago” (Tamir, 1998, p. 761). In the book edited by McComas (2000) just one chapter out of 21 is devoted to assessment. These facts underscore both the scarce attention devoted in the past and the current increasing interest in assessment and evaluation in science education. Years ago, some Science-Technology-Society (STS) education scholars expressed concern about the assessment of students’ learning demanding coherence between the students’ assessment and the STS educational aims (Hofstein, Aikenhead & Riquarts, 1988). They called for alternatives to traditional assessment, through valid instruments and new assessment criteria, specifically designed for assessment in the STS framework. The rationale for STS education is the multiplicity of potential approaches that allow students to grasp scientific knowledge of the interrelated, complex, and problematic world in which they live. Likewise, STS education is complex, diverse, and value-laden, which means that values are important new aspects embedded in STS education, in contrast to traditional school science (Ziman, 1994). In spite of the increasing importance of STS education in the reformed science curricula, the assessment of STS education is today in a precarious state and demands improvement (Acevedo, 1997). The value-laden aspect of STS adds special difficulties for teaching and mainly for assessing STS issues, as the teacher must assess not only scientific knowledge and procedures, as in traditional science classrooms, but also the values of science. Values have a strong affective meaning rooted in the human ability to select among different alternatives and are complexly integrated into STS contents and procedures. Beyond concepts, beliefs, or views more powerful constructs are needed in order to reliably account for values in STS education. In the next paragraphs “attitude” is suggested as the construct that allows for this integrated assessment of STS issues.
Attitudes in science education
The concept of attitude in Social Psychology arose from social (i.e. attitude to death penalty) and political (i.e. voting for candidates) issues, and has spread into many other fields such as education. Teachers in general, and science teachers in particular, often hold a common-sense concept of attitude, as a kind of interest (or disinterest) towards school science learning; for instance, when a student seldom participates in science classroom discussions, the teacher infers a poor attitude towards science. The concept of attitude is much more general, as it encompasses cognition, behavior, and feelings, and this is the main reason why it is used here, instead of other simple concepts, such as beliefs or views, which also are quite common in science education literature. On the other hand, attitude is a well-established construct in Social Psychology, and better founded than beliefs or views (Stahlberg y Frey, 1990).
Attitude is a hypothetical construct of social psychologists that can be defined as:
A psychological tendency that is expressed by evaluating a particular entity with some degree of favor or disfavor (…) A psychological tendency refers to a state that is internal to the person, and evaluating refers to all classes of evaluative responding, whether overt or covert, cognitive, affective or behavioral (Eagly & Chaiken, 1993, p.1).
The “entity”, also known as the attitude object, yields the stimuli (things, ideas, or persons) that elicit the evaluative responses expressing the attitude.
The use of the construct attitude here may seem a bit strange, but as long as many STS issues are value-laden, they require from the student (and the teacher, too), not only the knowledge of facts, but also adherence to a position, and/or even action in accordance with this position. Attitude is the construct that simultaneously contains the cognitive, affective, and behavioral components that account for the STS value-laden contents in science education. Cognition and understanding are always present, but the attitude’s central core is the individual’s choice along the attitudinal spectrum of positions between favor and disfavor, which is characteristic of the attitude. The term attitude accounts better for the kinds of questions raised in STS education, which encompass at the same time cognition (knowledge), feelings (agreement or disagreement) or behavior (e.g. acting to make the environment healthier). While science knowledge does not always imply an attitude (e.g. knowing the gravity law and its applications, as nobody argues against its validity), there is always some knowledge in the base of any science-related attitude (e.g. adhering to the position that science knowledge is tentative), as there are students or teachers who do not understand or embrace the position.
Attitudes in science education have had a long and difficult path between their conceptual clarification and their empirical assessment. Gardner (1975) suggested a distinction between two different attitudinal objects: attitudes towards science and scientific attitudes. In addition, many authors have assumed this distinction (Laforgia, 1988; Schibeci, 1983; Wareing, 1990). However, a multiplicity of attitudinal objects investigated in science education has been evident in the very large amount of attitudinal research. In summarizing this research, Hodson (1985) suggested new categories whose meanings are especially important in the framework of STS education: the attitude towards the social aspects of science and school science. Also, STS education is an innovative cross-curricular approach in the science school curriculum, which focuses on values in science (Aikenhead, 1994; Bybee, 1987; Vázquez & Manassero, 1997; Waks & Prakash, 1985), and attitude is the construct that best encompasses the aims for learning and teaching science and technology in society, as it integrates cognition, affect and behavior. In order to embrace systematically all the possible attitudinal objects in science education and STS teaching, each of which defines a different attitude, we are confronted with many different attitudinal objects. In order to cope with them systematically, Vázquez & Manassero (1995) suggested a taxonomy of science-related attitudes that categorizes the STS different multiple attitudinal objects into three basic dimensions and seven sub-dimensions (all of them referring to science and technology):
- Attitudes towards school science and technology, teaching and learning, the products of school science and technology.
- Attitudes towards the interactions between science, technology, and society: the social image of science and technology; the social aspects of science and technology.
- Attitudes towards the characteristics of scientific and technological knowledge: scientists’ and technologists’ characteristics; social constructivism in science and technology; the nature of science and technology.
The concept of attitude had been used throughout the research early on (Gardner, 1975; Gauld & Hukins, 1980; Haladyna & Shaughnessy, 1982; Munby, 1983; Ormerod & Duckworth, 1975; Schibeci, 1983, 1984) while currently, the literature display the terms concepts, beliefs, views, or ideas, perhaps due to the deep influence of the constructivist learning approach or simply of common-sense. Suggesting the term “attitude” to represent the complex (cognitive, behavioral, and affective) issues embedded in the dialectic value-laden STS themes is not just a mere nominal contention, but a theoretical change that can enlarge the simple meaning of the terms beliefs or views in science education. The precise way in which the construct attitude relates to other terms used in the literature (beliefs, views, etc.) and the reasons why attitude is a construct that better fits the characteristics of the STS issues –both cognitive, affective, and behavioral– could be revised in some references (Eagly & Chaiken, 1993; Manassero, Vázquez & Acevedo, 2004). Finally, let us emphasize that attitudes resume significant curricular objectives in STS issues as they convey values, the affective educational domain, but there are of course other important STS educational objectives, for instance in the cognitive or procedural domains. Attitudes are emphasized as the essential construct to achieve the objectives in the affective domain (values).
The measurement of science attitudes
Policy makers have included STS issues in the new reformed curricula as a direct consequence of the vast amount of evaluative research that showed that students and teachers do not possess an adequate conception of STS (for instance, see Lederman, 1992).
Research on science-related attitudes has repeated some of the failures that occurred in the progress of general attitude research in Social Psychology because it has been undertaken ignoring them (Shrigley & Koballa, 1992). The conceptualization and measurement of attitudes within Social Psychology have developed two basic traditions: psychophysical scaling and psychometric assessment. Psychophysical scaling is based on grading the stimuli applied to people and observing their reactions on a psychological dimension. The origin of psychometric assessment lies in the methods of mental and psychological testing. Likert and Osgood’s semantic differential scales correspond to the psychometric tradition, whose validity is based on the ability of each item to adequately represent the scales’ underlying attitudinal object (almost always taken for granted).
The controversies surrounding the validity of attitude assessment instruments and processes have been frequent. Several reviews (Gardner, 1975; Gauld & Hukins 1980; Schibeci, 1984; Shrigley & Koballa, 1992) agree on the important methodological shortcomings of the attitude assessment instruments, and the results obtained through flawed instruments have been widely criticized (Gardner, 1996). The criticisms can be summarized as follow:
- The instruments’ inaccurate definition of the attitude object (criterion inadequacy), and the lack of correspondence between what we want to measure and what we actually measure (Gauld & Hukins, 1980).
- The lack of a sound explicit epistemological foundation for instrument contents; given the complex and dialectical nature of the contents of science-related attitudes, the absence of specifications for the scales’ philosophical basis weakens the results and interpretations obtained from these instruments (Aikenhead, 1988; Gardner, 1975, 1996; Haladyna & Shaughnessy 1982; Schibeci, 1984; Ormerod & Duckworth, 1975; Shrigley & Koballa, 1992).
- The instruments implicitly violate the one-dimensional hypothesis, which is a condition for achieving valid measurements. The questionnaires frequently lack a unique common construct for all items, and they sometimes show an explicit multidimensionality (Bratt, 1984; Munby, 1983; Zeidler, 1984). In these cases, the measured attitude is not single, but multiple.
Other validity-related problems are the pupils’ biases to satisfy their teachers’ expectations and the difficulties of item wording (i.e. the “immaculate perception” doctrine, the implicit hypothesis that students and researcher perceive the same meaning from the statements in questionnaires). Finally, the confrontation between the quantitative paradigm and the qualitative, based mainly on clinical interviews and case analyses, is another controversial issue for attitude researchers. Demands to “de-kuhnify” the discussion, break the stereotypes and open up the process, are bringing about approaches for the integration of both methods, rather than excluding either of them (Shadish, 1995).
The STS attitudinal assessment instruments
The STS contents (nature of science and technology, relationship between science, technology and society, etc.) have been elaborated through the attitudinal instruments applied in research. A review of the instruments used to assess STS attitudes has been presented elsewhere (Lederman, Wade & Bell, 1998; Vázquez & Manassero 1995).
As previously noted, the reliability and validity, as well as the biased interpretation of the results of attitudinal assessment instruments, have frequently been the main source of methodological pitfalls in STS assessment, and this has brought them into question (Gardner, 1975, 1996). Aikenhead (1988) compared the reliability of different techniques, namely Likert scales, open-ended questions, empirically developed multiple-choice questionnaires, and semi-structured interviews, and concluded that the empirically developed multiple-choice questionnaires are the most balanced instrument as they reduce ambiguity, can be applied to large samples, which increase the representation of results, and can avoid the methodological pitfalls, such as the immaculate perception doctrine, of questionnaires developed by researchers. Recently, Lederman, Wade & Bell (1998) reviewed the instruments used to assess conceptions of the nature of science, and questioned their validity because of poor construction s and biased interpretations of the results. Although these authors concluded that the assessment of individuals’ concepts of the nature of science should be shifted towards more qualitative, open-ended approaches, they considered the multiple-choice paper and pencil Views on Science-Technology-Society (VOSTS) a valuable instrument for the assessment of students’ views and as an attempt to probe students’ reasons for the responses they produced.
The VOSTS is an empirically developed 114-item pool (Aikenhead, Fleming & Ryan, 1987; Aikenhead & Ryan, 1989, 1992) that encompasses all the STS contents. Assuming the same standards of the VOSTS, Rubba & Harkness (1993) developed an additional set of multiple-choice items, the Teacher's Belief about Science-Technology-Society (TBA-STS), to investigate teachers’ beliefs on STS issues. The Spanish COCTS (Spanish acronym for Questionnaire of Views on Science, Technology, and Society) has one hundred items, selected from the VOSTS and the TBA-STS, and adapted to Spanish language and culture. The COCTS has been applied in recent research into students’ and teachers’ STS attitudes (Manassero & Vázquez, 1998).
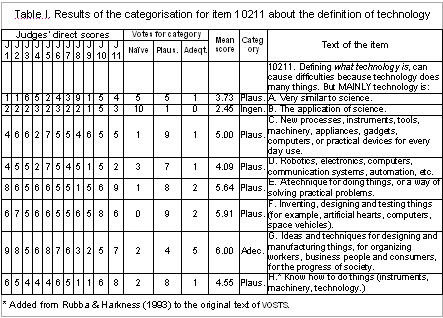
A typical COCTS item displays an initial text, which raises an STS issue, then follow several statements labeled with a letter in alphabetical order, each developing a short and different reason to account for the issue. Within each item, the whole set of statements offers to the respondents a wide array of positions; the respondents elucidate their attitude when they differently select or rate each statement. This way to define attitudes means that the questionnaire does not impose on the respondent any specific values or models about STS; on the contrary, the respondents can freely define their attitudes through their choices on the statements. Table I display an example of item, the scores from judges to its statements and the category assigned to each statement (according to the criteria developed along the paper). The COCTS Spanish version and its related materials including the manual and the scoring keys have recently been incorporated to the extensive library Test Collection of Educational Testing Service (available on line at: www.ets.org).
The basic response format proposed for the VOSTS consists of selecting one option among the multiple statements in each item (Unique Response Model, or URM). The URM is methodologically limited, since it only permits comparisons centered on each particular item, but it does not empower test-retest comparisons or hypothesis testing. Rubba, Schoneweg-Bradford & Harkness (1996) proposed scoring the item’s unique response according to the three-category scheme (Realistic / Has Merit / Naïve), previously assigned by experts to response statements, which better reflects the attitudinal character of the assessment. This three-category scoring procedure was suggested by one of the VOSTS authors in a personal communication (Rubba & Harkness, 1993). In the case of answers to several items, the individual item scores are summed up to get a total score, which is internally consistent and attitudinally significant (more or less adequate attitude). This method improves the simple URM, but it does not reliably or adequately discriminate the attitudes that it intends to measure. The URM has a second profound limitation: since it measures the attitude based on a single statement, it does not use all the information available in the remaining non-selected multiple-choice statements.
To overcome this important drawback, a Multiple Response Model (MRM) has been suggested, in which the respondents rate all the alternatives in the item on a 9-point rating scale to express their level of agreement / disagreement. Then the statements’ ratings are transformed into a global attitudinal index (full range: -1, +1) by means of an interpretative method that requires a previous classification of each statement into a three-category scaling (Vázquez & Manassero, 1999):
- Adequate (A): the statement expresses an appropriate view.
- Plausible (P): though not totally adequate, the statement expresses some acceptable aspects.
- Naïve (N): the statement expresses a view that is neither adequate nor plausible.
The three-category scheme for assessing item responses is not a true/false procedure of searching correct answers; it has nothing to do with an absolute framework because it is only relative, in accordance with the current dialectic knowledge of the history, epistemology, and sociology of science. It is expected that the effectiveness of the categorization will be improved when the progress of the current controversies can shed new light on STS issues. On the other hand, the categorization has nothing to do with the sharp correct or incorrect marking procedures usual in standardized science tests, because it computes students’ attitude on the base of the whole set of students’ responses across all the item statements as adequate, plausible, and naïve, and not solely on the basis of discovering one of them.
The VOSTS has traditionally been used to assess respondents’ attitudes for descriptive and formative purposes. The summative purposes are excluded from the possibilities of VOSTS because URM is unable to achieve any summative aim, as required in research or even education. The aim of this work does not entail to substitute any descriptive or formative purposes from the assessment through COCTS, rather it enlarges the possibilities of the instrument, deepening the description and widely improving the formative goals while maintaining all the previous methodological advantages.
Scaling the statements through judges
To implement properly the three-category scale, it is required a previous categorization, or scaling, of all the questionnaire’s attitudinal stimuli, which are represented by the multiple-choice statements of each item. So the categorization of statements is a significant step for the reliable assessment of STS issues. The aim of this paper is to present the method and the results for the categorization of COCTS statements into one of these three categories through item scaling. Thus, the focus will be on group judges’ responses rather than on statement-level analyses, which moreover would need lots of pages and tables due to the high number of statements that are analyzed. Underlying the huge amount of research on attitudes towards science is the fact that there are some adequate conceptions, as well as other, less adequate beliefs. Yet the focus of the study is not the application to assess the students’ or teachers’ scores, although one of the main utilities of the method will be the research involving assessments of STS ideas.
Although the general procedure of item scaling is similar to Thurstone’s or Guttman’s scaling (Early & Chaiken, 1993), some STS areas are still highly controversial, so that agreement about the appropriateness of a statement is difficult to achieve, even for scholars (Alters 1997a, 1997b; Smith, Lederman, Bell, McComas & Clough, 1997). For instance, McComas, Almazroa & Clough (1998) suggested some points of consensus on the nature of science (empirical, rational, tentative, theory-laden,…), although the real core of the difficulties in defining adequate conceptions stems from the dialectic and uncertain aspects involved in many STS issues. Consequently, tentativeness becomes a central feature of the outcomes reached through the item scaling technique because of the dialectical and controversial nature of STS topics. Rubba, Schoneweg-Bradford & Harkness (1996) categorized their16 items by means of five judges, reporting that two of them were found outliers, which features the difficulty to assess STS issues. They recommended that at least nine judges should be used and that agreement among at least seven of the nine judges be used as the criterion to decide the category of each statement.
On the other hand, some research studies in science education have reported that one person can display different or opposite beliefs (intra-personal diversity) about the same issue when surveyed through items that differ in format or context (Acevedo, 2000; Clough & Driver, 1986; Oliva, 1999; Taber, 2000). In attitudinal research, the presence of simultaneous opposite attitudes in the same person is a well-known fact that is commonly attributed to the latent role of attitudes, especially when they refer to topics not explicitly taught, as is the case in STS issues, at least in the case of the Spanish science school curriculum. In general attitude research these opposite attitudes have been called indifferent, intermediate, incoherent, ambivalent or ambiguous answers. In spite of their scarcely defined appearance, they have frequently been attributed to the methodological weaknesses of the measurement instruments. Thus, the attention has been focused on improving the accuracy of measurement instruments (Breckler, 1994). However, some scholars (Eagly & Chaiken, 1993) recognize that inconsistency in attitudes is a complex problem arising from behavior, cognition, or affect consistency, though the question addressed here (about ambivalent answers) refers mainly to consistency between attitude and cognition. Some research claims that highly consistent people show attitudes that are more stable, more predictive of behavior, and more resistant to influence induction, though other findings call into question whether low consistency people lack a genuine attitude (Chaiken, Pomerantz & Giner-Sorolla, 1995). Moreover the complex beliefs can be associated with moderate attitudes, but they also can be associated with extreme attitudes, completing the difficult picture of this issue even in basic attitude research (Eagly & Chaiken, 1993). The MRM proposed for use in the COCTS, along with the categorization obtained in this study permits, in a natural way, the measurement of these various coexisting contradictory attitudes on a topic within the same person by means of individualized analysis of the answers in each item. The proposals about refining the measurement of attitude strength may help to deal with ambivalence or inconsistency in science attitudes (see contributions in Petty & Krosnick, 1995), and in this scope, the global attitude index may represent a great practical advance for science attitude measurement.
In the framework of the assessment of science attitudes, this study shows the scaling process for the multiple-choice statements of the COCTS items by means of a panel of experts acting as judges. This scaling process is the final stage of the empirical procedures designed elsewhere (Vázquez & Manassero, 1999) for the development of a measurement method that allows the valid use of COCTS items in quantitative STS attitude assessment, including hypothesis testing and group comparisons.
Scaling methodology
A valid sample of 16 Spanish experts produced scoring judgments about the items. All of them are accredited as potential competent experts to issue valid and reliable judgments on the COCTS statements because of their specific training in STS issues, independent of their jobs or initial background. A majority (13) possesses a scientific background (physics, chemistry, biology or geology graduates), and 3 of them are philosophy graduates. Their current jobs are as secondary teachers (5), as science advisers in teacher-training schools (4), and as university teachers and researchers (7). Majorities (12) are involved in science education research, and some of them (8) have published research papers on STS topics. Rubba, Schoneweg-Bradford & Harkness (1996) used only 5 judges (teachers and scientists) and then recommended a minimum of 8-9 judges to achieve a more valid categorization.
The judges were provided with the items of the COCTS items and asked to score each statement on a 9-point scale (1-9), expressing their disagreement or agreement in relation to the current knowledge of history, philosophy, and sociology of science. In order to assign clear significance to scale points, to increase accuracy and reliability, and to procure a simple vote for the judges’ direct ratings, the 9-point scale was divided into three equal intervals:
- Scores 1 to 3: Naïve category (N) (inappropriate statements),
- Scores 4 to 6: Plausible category (P) (partially appropriate statements),
- Scores 7 to 9: Adequate category (A) (appropriate statements).
The choice of the 9-point scale was made on the basis of simple integer use to assess the three categories, giving the judges the opportunity to spread their judgments, rather than to restrict their judgments to a minimal 3-point scale, which would have been simpler for quantitative purposes, but very much reduced and too narrow to express slightly different opinions of the judges. These assignments define, at the same time, a three-category scale corresponding to natural ranges with a fixed meaning: adequate, plausible, and naïve, and the original 9-point integer scale, which allows judges to pinpoint their scores within each category and to obtain a clear perception of the meaning for each score.
The COCTS pools contain 100 items along with 637 response choice statements, each conveying different attitudes and opinions on the topic outlined in every item. Each of 16 judges is considered a relevant variable of the analysis, while the 637 statements that make up the COCTS are considered the cases of the description. This study is aimed to show the empirical and rational procedures and analyses developed to assign each statement to one of the three suggested categories (naïve, plausible, and adequate), starting from the judges’ direct scores; it is centered in the judges, not in the items. The criteria for the assignment of categories to the statements should be deduced from the scores granted by the judges. The first criterion will be the judges’ mean score on a statement, since this parameter collects all the nuances of judges’ ratings. The second criterion will be the majority of judges in favor of a specific category through their scores. The categorization of the COCTS statements in one of the three standard categories will be grounded on these two basic criteria, tempered by the global patterns and biases of the judges’ scores.
The judges rated all the 637 statements, but five judges declined to score four items which concern the influence of culture and religion on scientific knowledge, the elegance of scientific theories, the probabilistic nature of scientific knowledge, and the role of a supernatural being in science. For these items, the answers of the objectors are missing, resulting in a lower number of votes than judges.
Scaling results
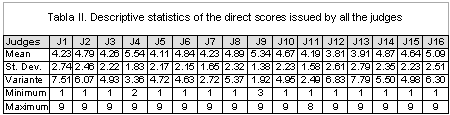
The descriptive statistics of the judges’ scores (means, variances, ranges, etc.) show the existence of specific trends in their answers, such as scoring too high or too low, or not using all the integer scores of the 9-point scales (Table II). The difference between the judges’ highest (J4) and lowest (J12) mean scores is about two points (25% of the range of the scale). Also the judges’ standard deviations are spread out quite a lot, with a minimum of 1.38 points (J9) and a maximum deviation of 2.79 (J13). On the other hand, some judges do not use the nine points of the scale to assess the 637 statements of the COCTS items. Two of them (J4 and J9) do not score any statement with one point, and moreover J9 never uses the 2-point score. Another one (J11) never uses a score of 9, so his or her maximum score is 8. In short, these statistical features about the global distribution of judges’ scores prove some individual biases of judges.
To improve the quality of the decision-making about statement categorization, these biases raise a question about the selection of judges. The rejection of a judge must be well grounded, and for that reason, additional analyses of underlying dimensions in the answers of the judges (principal component factor analysis, cluster and discriminant analyses) were developed, to delve much more deeply into judges’ response styles.
Cluster and discriminant analyses served to check the stability of the COCTS statement categorizations in each of the three categories. Cluster analysis uses a measurement distance to assign each statement to a group, according to the relative proximity among the members in the group. Using the scores assigned by the judges, the cluster grouped the COCTS statements into three conglomerates (ideally corresponding to the naïve, plausible, and adequate categories).
Discriminant analysis starts from the knowledge about the individuals’ membership of some groups to deduce the assignment of a new individual, whose group is not known. Then, the results of the previous cluster analysis were used as the membership assignment for discriminant analysis to test the stability of the previous assignment. The results of the discriminant analysis prove that the three empirical groups display good stability across the two analyses, cluster and discriminant, and validate the use of the three categories to classify all the COCTS statements. Thus, the results of the cluster and discriminant analyses empirically confirm the stability and robustness of the three-category categorization system for the COCTS statements.
Principal component factor analysis
Principal component factor analysis (PCFA) allows for the reduction of the number of the description variables by searching for new variables (called factors) that summarize the whole variance into a number of factors that is lower than the number of original variables. The dependent variables of the factor analysis are the judges, while the independent variables are the judges’ scores on the COCTS statements. The analysis groups the judges according to the intensity of their mutual correlations across the 637 statement scores so that the best interrelated judges tend to be grouped into the same principal factor. The principal component analysis allows for the identification of the judges who systematically lie outside of the main factors in the different dimensions.
Several independent factor analyses were run for all the statements and for each of the COCTS dimensions. According to the results of the exploratory analyses, several judge eliminations were tested to optimize the maximum empirical coherence among judges and the maximum parsimony (simplicity) in the number of factors. Eliminating some judges in successive factor analyses showed that the total variance explained by the empirical factors was not significantly affected. But the number of factors decreased, and the correlation and the cohesion among the remaining judges improved.
Table III shows the factor analysis of the principal component for all judges, the number of factors and the variance that these factors explain for each dimension (Table IV). The factor analysis, with all the statements of the questionnaire, groups the 16 judges into two factors, each explaining 33% and 20% of the total variance. For each COCTS dimension, a different number of factors are obtained, oscillating between two and five, though most of the dimensions (four out of eight) have a three-factor structure.
The information from these analyses suggests that reducing the number of judges would allow a significant reduction in the number of factors (approximately half of the factors), and also would increase the coherence without losing the necessary plurality of opinions. On the other hand, the different factor analyses indicate the judges who are spread apart from the principal factors, and who are the most likely candidates to be eliminated without decreasing the explanatory power (those who decrease the explained variances significantly). Based on this interpretative analysis, 5 judges were removed from the initial set of 16 judges, leaving a set of 11 judges to retest the new factor analysis.
The principal component analysis of these 11 judges (Table III) shows the number of factors and the amount of variance explained in each dimension. For all the COCTS statements, the 11 judges are grouped into a unique factor that explains 52% of the total variance. For each dimension, a variable number of factors (one to three) are obtained, though most of the dimensions (five) have just one factor. To sum up, the 11-judge group displays a number of factors that are half the number of factors for 16 judges, thereby significantly increasing the coherence and parsimony of data description.
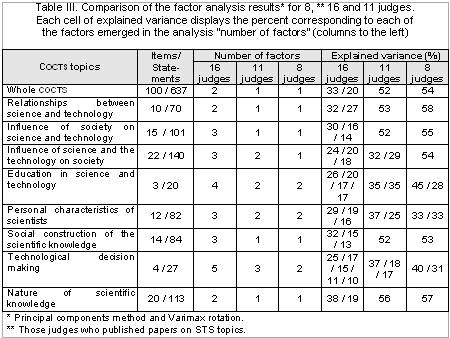
Testing the elimination of three more judges (leaving just an 8-judge set that includes those judges having researched the STS topic), the comparison of results with those of the 11-judge set does not display significant improvements. The number of factors is almost the same in both situations, and differences in the explained variance are not important (Table III), except in two topics (one of them with four items only). In other words, this additional removal of judges does not carry a substantial improvement in the global coherence of judges. Thus, based on these analyses, the set of 11 judges seems the best set for COCTS statement categorization. The selection of 11 judges from the initial 16 available valid judges permits a notable reduction in the number of factors without a significant decrease in the explained variance percentage. A unique factor explains more than half of the total variance for the whole set of the questionnaire statements, as well as for half the dimensions of the COCTS, a result that is particularly relevant for parsimony and simplicity.
Categories for the COCTS statements
It is important to note that the above criteria applied for the reduction of judges were global, that none of the criteria were specific or personal, and that they were based on the analysis of the whole set of 637 scores issued by the judges.
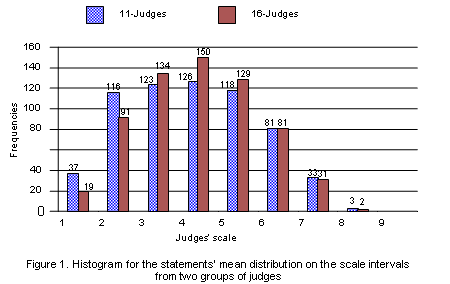
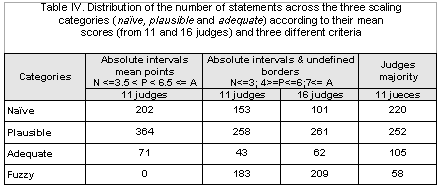
Reducing the number of judges to 11 does not have a significant impact on categorization for the COCTS statements. The comparison of the direct score distribution between both groups of judges (11 and 16) shows that the quantitative differences between the two groups are not relevant; nonetheless, the 16-judge group shows greater frequencies in the central scores of the scale, while the 11-judge group shows greater frequencies in the lowest scores (see Figure 1).
On the other hand, the comparison of the statement categorizations based on the absolute interval criterion and fuzzy border zones (scores between 3-4 and 6-7) shows that the total number of statements changing their categorization is not high (approximately 14%). The most important difference between both groups of judges arises in the naïve category (see Table IV).
The scores of the 11-judge group's direct answers were used to classify all the statements of the COCTS (scaling) in each of the three categories (N/P/A) by applying two fundamental criteria: the statement’s mean score (arithmetic mean of the individual scores of the 11 judges), and the majority voting of judges in favor of one category (selected by most of the judges). Generally, it seems reasonable that all the statements whose mean scores belong within the natural integer intervals defined in the scale presented to the judges must be assigned to the category where its mean belongs. So the 1-3 mean scores would be naïve, 4 to 6 mean scores would be plausible, and 7 to 9, adequate. Some statements had mean scores belonging to the border intervals (3, 4) and (6, 7), which would not be categorized according to the previous criterion (statements labeled “fuzzy” in Table IV).
In the absence of bias or distortion in the judges’ scores, the categorization of the statements whose mean scores lye in the border intervals, between two neighboring categories, could use the simple criterion of splitting the whole border interval in two equal parts, and assigning each mean to the corresponding part (Table IV). However, the judges’ scores display two important biases, one stemming directly from the distribution of the statements’ mean scores and the other due to the categorization system itself.
The statements’ mean score distribution shows a bias towards the low scores (see Table III and Figure 1). The main indicators of this bias are the judges’ personal mean scores lower than 5 points (the central point of the original scale) for most of the judges, and the general distribution of the judges’ statement mean scores (mean = 4.43; DT = 1.60), which is biased towards the lowest scores. On the other hand, the mean scores of the judges for each statement are not distributed homogeneously along the whole range of the scale, which has an eight-interval length, with nine integer positions. The judges’ mean scores on 637 statements yield a 1.18-point minimum score and an 8.18-point maximum score, which is clearly asymmetrical in relation to scale range. The distance between the minimum and the maximum mean score is just 7 points, which means that the real scale stemming from the judges’ scores becomes contracted by one unit (one interval shorter) in relation to the original scale (eight intervals long). Furthermore, it may be seen that the greatest contraction of the scale takes place in the highest interval of the range, between 8 and 9 points, which is practically empty and useless (Figure 1). This negatively biased distribution manifests the judges’ pattern of misuse of the highest scores, as the judges assign fewer high scores than low scores.
The categorization criteria of the statements would take this bias into account to represent more reliably the judges’ opinions. One way to compensate the biased consequences consists in maintaining a balanced scaling of three equal intervals but applying this scaling to the real range [1.18 - 8.18] of scores. For example, if this real interval is homogeneously distributed among the three categories, each category would have an interval length of 2.33 points, so that the possible scaling based on the real mean scores would draw this homogeneous interval criterion with the following cut-off points: naïve, lower than 3.52; plausible, between 3.52 and 5.84; adequate, higher than 5.84 points.
The application of these cut-off points would lead to a clear categorization for the statements. However, this categorization may still be incomplete, as it is only based on the judges’ mean scores, setting aside other details of their scores. The first of these details to take into account would arise from the categories assigned through the judges’ direct scores on the statements, as if these scores were a polled vote in favor of each category. It seems common sense that the statements achieving an absolute (six favorable votes) or relative (five votes) majority must be assigned to the most-voted category. Nevertheless, the voting criteria has some hindrances, for instance, when two categories reach the same majority vote; in this case, the voting method does not allow a decision for either category, and the main criterion must be the judges’ mean scores.
There is another structural bias, which stems from the 3-category structure adopted for the scaling, naïve (lowest scores), plausible (intermediate scores), and adequate (highest scores). The structural bias stems from the well-known tendency of mean to centralization, which pushes the categorization to the intermediate category (plausible). The potential deviations from the lowest scores can only tend towards greater scores, because some judges assess the presumably naïve statements with higher scores than those of the naïve scores, always dragging the mean scores of the naïve statements upward and increasing the number of statements in the plausible category. Conversely, the highest scores tend to be deviated downward, because some judges assess adequate statements with lower scores, increasing the number of plausible statements. On the other hand, for potentially plausible statements, the biased deviations can tend upward, achieving higher scores, as well as downward, achieving lower scores; on the whole, the mean net effect of these random deviations would be null. This structural bias produces inflation in the central category (plausible statements) because the plausible category is topologically the intermediate category between the other two. To sum up, the final effects of these biases would always increase the number of statements in the plausible category.
The most likely statements affected by the structural bias, and susceptible of compensation, should lie in the lowest and the highest border areas of the central (plausible) category. Addressing this structural bias would require decreasing the number of plausible statements, switching some plausible statements into naïve or adequate statements. A way to deal with this bias would be to reduce the range of scores assigned to the central (plausible) category by deciding the most appropriate cut-off points for each category. The homogeneous interval model with its cut-off points at 1.18 - 3.51 - 5.84 - 8.18 has its intermediate cut-off point above a score of 3, the highest naïve score from judges, and on up to 3.51 points, such that the scores in the border zone, between 3 (end of the naïve scores) and 4 points (beginning of plausible scores) could correspond to either category, naïve or plausible. It seems quite rational to assign the statements lying in the lower half to the first category (naïve), while assigning those statements lying in the upper half to the central category (plausible). Likewise, the border area between adequate and plausible categories has its cut-off point at 5.85, which is below 6, the highest integer score assigned to the plausible category, giving rise to a significant conceptual problem, since it would assign some statements with mean scores lower than 6 (the feature of the plausible category) to the upper category (adequate). It seems obvious that the minimum conceptually acceptable cut-off point must be the score of 6. The results for the category assignments according to the model of fixed cut-off points at the score of 3.51, for the border between naïve and plausible, and at the score of 6, for the border between plausible and adequate, are shown in Table V. With this cut-off point model, the number of statements in the plausible category is still by far the most frequent (almost half of the statements).
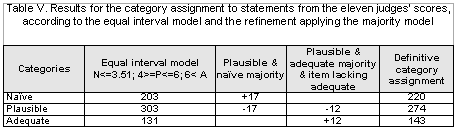
On this point, the analysis of the judges’ majority votes could improve the category assignment for a couple of statements. Some statements (17) located in the inferior border area have mean scores higher than 3.51 points (corresponding to the plausible category), but most of the judges have assigned them individual scores in the naïve category. It seems rational in these few cases to set up compensation against the skewing bias of the intermediate (plausible) category: the criterion of the majority of judges would prevail, definitively assigning these statements to the naïve category.
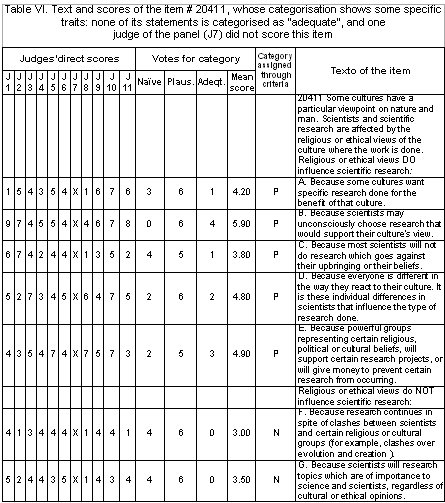
Similarly, some statements (19) located in the superior border area get the judges’ majority for the adequate category from their individual scores, although their mean scores are lower than 6 points (the highest integer score belonging to the plausible category). In this case, it does not seem appropriate to apply the most-voted category criterion to categorize all these statements as adequate without any other additional discrimination, which would make it strictly necessary. In this context, strictly necessary is interpreted and applied to those statements belonging to an item that does not have any statement categorized as adequate. Then, only 12 of the 19 statements fulfill both conditions, and should be assigned the adequate category, although their mean scores were lower than 6 (see an example in Table VI).
In the end, these categorization assignments for the COCTS statements based on the mean scores and the judges’ majority votes still leave eight items whose statements only receive naïve or plausible categorizations, lacking adequate statements. As a last resort, the category assignment for these eight difficult statements would require careful scrutiny of their contents, and perhaps new judges’ scores to improve their design and categorization.
Conclusions
In recent years, the measurement of science attitudes has been improved through the contribution of qualitative research (interviews and portfolios) and quantitative research (see the review of Lederman, Wade & Bell, 1998), in which empirically developed questionnaires such as the VOSTS (Aikenhead & Ryan, 1989), the TBA-STS (Rubba & Harkness, 1993) and their Spanish adaptation the COCTS (Manassero & Vázquez, 1998) stand out, because they offer some advantages in qualitative and quantitative methods. Different models for answering the questionnaires, other than simply choosing the most preferred statement per item, have been suggested and discussed to improve their implementation.
The Multiple Response Model (MRM) offers significant improvements over any of the partial response models, since it deals with all the available information in each item. To implement the MRM and its scoring procedure (computing an attitudinal index), the categorization of the multiple-choice statement choices is needed.
This paper reports the scaling methodology, applied through a panel of judges, to classify the COCTS statements in one of the following three standardized categories: naïve, plausible, and adequate. The scaling of COCTS statements is a cornerstone for the computation of an independent global quantitative attitudinal index for each item justified elsewhere (Vázquez & Manassero, 1999). This proposal offers interpretative and quantitative advances in science attitude assessment and for subsequent empirical investigation studies, as the attitudinal index permits all types of inferential statistical procedures (comparisons between groups, hypothesis testing, etc.), usual in empirical research.
The validity of the attitudinal index for quantitative research is clear, but also at the same time, attention must be paid to the interpretative features of the COCTS, for instance, the ability to describe qualitative details of individuals’ attitudes with respect to a wide range of STS issues. Therefore, this proposal allows us to achieve the following goals: to measure attitudes validly, to profit all the information in each item, to profile individuals’ interpretative attitudes, and to be able to implement to the responses the quantitative methods, statistical analysis and inferences.
Rubba, Schoneweg-Bradford & Harkness (1996), in their seminal work applying a majority consensus among five judges, found significant differences in judges’ views about STS interactions (two of them were proved “outliers”) recommending that the number of judges must be increased. The COCTS statement categorization from judges presented here is based on the scores of an 11-judge panel, extracted from a 16-judge set by means of global non-individual statistical standards (general descriptive statistics of the judges’ scores and principal component factor analyses). The criteria implemented to garner parsimony and consistency and to avoid biases were plural: judges’ mean scores, judges’ majority consensus, and some corrections of global biases, such as the definition of an asymmetrical equal interval scale and the compensation for the absence of an adequate category in some items. After rationally setting up these criteria through the methodology described above, the 637 multiple-choice statements of all COCTS items have been categorized into one of the three categories, leading to 143 statements in the adequate category, 274 statements in the plausible category, and 220 statements in the naïve category.
The categorization of the COCTS can still have a role in STS curriculum development for science classrooms, as a curricular guide to the wide range of STS topics. In fact, each item can be viewed as an introductory approximation to the different positions on the item’s STS topic, which are worded in their multiple-choice statements. Furthermore, the great variety of issues represented in COCTS items can allow schools and teachers to select, sort, and develop the STS contents across the educational stages and classrooms, select the appropriate set of items to develop topics, and follow the COCTS items as scripts. Second, the STS items can be implemented as explicit STS contents in science classrooms in several methodological ways, such as fomenting discussions among students, seeking out historical cases, reading illustrative texts, or searching for authors who favor and oppose different choices. Taking into account the fact that science teachers receive little training in STS topics, the former curricular recommendations are also valid for initial teacher training, or in-service training which is aimed at updating and improving teachers’ attitudes towards STS issues (Abd-El-Khalick, Bell & Lederman, 1998; Akerson, Abd-El-Khalick & Lederman, 2000).
The scaling processes by means of judges always have a statistical mismatch that challenges the global quality of the COCTS as an STS assessment instrument. This mismatch stems from the variability due to the dialectical character of STS topics, and from the categorization process itself, since it involves the use of statistical parameters affected by random human errors. These sources of statistical error prompted by judges' scaling are a valuable but tentative step that needs improvement in subsequent iterative feedback processes. For instance, Rubba, Schoneweg-Bradford & Harkness (1996) achieved consensus through open discussion with their (five) judges, a task that is beyond the scope of the present study because our panel members come from distant places, and therefore the task of review is really very difficult. One judge (a scientist) remarked about the categorizing task on STS items that it was “one of the hardest tasks I have ever had to complete” (Rubba, Schoneweg-Bradford & Harkness 1996, p. 396). Instead, we challenge the science education researchers to discuss our results, which has been published (Manassero, Vázquez & Acevedo, 2001). Although it might seem so, we do not at all uphold the belief that there is widespread agreement within the communities of science, history, philosophy, and sociology of science; if this were the case, we obviously would have not appealed to judges to categorize positions. Although our results here can be interpreted as proof of the lack of consensus in STS, it is still useful to underscore that some partial consensus there exist about STS (McComas, Clough & Almazroa, 2000), as emerged from the results of judges. The categorization does not mean any kind of absolute system key to rigidly classify the answers as right or wrong, but only a system just to profile roughly people’s attitudes.
The COCTS and VOSTS items were empirically developed as an attempt to avoid the common flaws of the attitudinal assessment instruments applied in the literature mentioned above. The empirically developed nature of the COCTS is certainly a methodological strength, but the scaling process by means of judges posited some specific weaknesses. Some judges expressed dissatisfaction and criticisms about some specific items; for instance, some judges were unable to find any adequate statement for several items. On the other hand, one judge claimed that some items needed a more balanced and symmetrical distribution of choices in order to represent more adequately the whole range of potential answers (between the two attitudinal extremes). Furthermore, the scaling process by means of judges displayed some other specific difficulties that need to be addressed, such as designing more balanced items to allow us to present all three categories for each item (for example, enlarging the number of choices in some items). These suggestions are especially critical because they affect the empirically developed character of the items, and some items would have to be modified or reconstructed and perhaps would lose their initial empirical properties (construct validity).
Addressing these claims would represent a net improvement for the quality of the COCTS, because the claims expressed by judges stem from their expertise and are not likely to fall within the ken of lay people. However, in order to maintain the empirically developed character of the COCTS, the manner in which to improve it must move forward cautiously, for instance, through some kind of empirical pre-testing for the new statements.
Finally, it should be emphasized that the attitudinal approach to STS may sound strange to many who would prefer the terms “conceptions”, “views”, or “beliefs”. Both approaches may be complementary, but in our view, the attitudinal approach seems more global, while the conceptual approach is limited to factual or procedural knowledge. This difference can be seen in a classic example: the difference between the knowledge about the adverse effects of tobacco on health and one's attitude (agreement or disagreement) towards smoking; that is, the understanding of tobacco's effects on health is a key factor that may affect one's attitude, but it is not the only determining factor, and in fact, there are lay people who do not smoke at all and doctors who are heavy smokers. The same applies to the value-laden nature of STS issues: one can understand the processes of global warming, but at the same time one can also behave contradicting that understanding. In our view, it is the responsibility of school science to contribute significantly to the understanding of science in our society, which certainly can be interpreted in terms of knowledge, but also in terms of students’ civic convictions, commitments, and behaviors.
The attitudinal approach integrates quite naturally knowledge, affect, and behavior, and highlights better the consciousness that school science must have to meet educational value goals, which imply understanding, but also personal choice, which are key goals for all students. In general, educating to achieve value goals does not mean inculcating a certain set of values about science and technology; rather it means to expose the whole set of values around an issue, (as each COCTS item displays a wide range of possible positions on the issue), explore and discuss them, and facilitate personal adherence when possible. In some specific cases, where scholars highly agree (i.e. the tentative nature of scientific knowledge, the creativity in science methodology, the influence of society on science, etc.), educating to achieve value goals means also to point out to the adequate answer.
Compared with other instruments, the scaling procedure presented here adds a more complete system to quantify the STS profile on an STS issue, showing explicitly the framework to compute the scores (Manassero & Vázquez, 2002, Manassero, Vázquez & Acevedo, 2003). On the other hand, the quantitative method does not exclude the interpretation of data analysis; in fact, the simplest analysis based on each statement gets quickly qualitative conclusions (Manassero, Vázquez & Acevedo, 2004). However, the goal of the implementation is not to label people or groups according to their attitudes’ degree of appropriateness, but helping to deeply describe and compare their complex positions.
Lastly, this paper does not assume that general consensus exists about STS issues, although partial consensus is emerging too about some specific issues (McComas, Clough & Almazroa, 2000; Vázquez, Acevedo y Manassero, 2004); rather there is an explicit recognition that the main difficulty to assess STS issues is the lack of consensus. In this case, the categorization is just a tentative, but explicit, assessment framework, which is submitted to the criticisms of the of science education community. All in all, the application in future research projects of the categorization presented here in the assessment of science-related attitudes on STS topics through the MRM and the new metrics should provide the real empirical test for these features of the COCTS.
References
Abd-El-Khalick, F., Bell, R. L. & Lederman, N. G. (1998). The nature of science and instructional practice: making the unnatural natural. Science Education, 82 (4), 417-436.
Acevedo, J. A. (1997). Ciencia, tecnología y sociedad (CTS). Un enfoque innovador para la enseñanza de las ciencias. Revista de Educación de la Universidad de Granada, 10, 269-275.
Acevedo, J. A. (2000). Algunas creencias sobre el conocimiento científico de los profesores de Educación Secundaria en formación inicial. Bordón, 52 (1), 5-16. Retrieved January 10, 2005, from the Sala de Lecturas CTS+I Section, of the OEI: http://www.campus-oei.org/salactsi/acevedo18.htm
Aikenhead, G. S. (1988). An analysis of four ways of assessing student beliefs about STS topics. Journal of Research in Science Teaching, 25 (8), 607-629.
Aikenhead, G. S. (1994). Consequences to learning science trough STS: a research perspective. In J. Solomon & G. S. Aikenhead (Eds.), STS education: International perspectives on reform (pp. 169-186). New York: Teachers College Press.
Aikenhead, G. S., Fleming, R. W. & Ryan, A .G. (1987). High school graduates' beliefs about science-technology-society: I. Methods and issues in monitoring students views. Science Education, 71 (2), 145-161.
Aikenhead, G. S. & Ryan, A. G. (1989). The development of a multiple choice instrument for monitoring views on science-technology-society topics (Final report of SSHRCC Grant). Saskatoon, Canada: University of Saskatchewan, Department of Curriculum Studies.
Aikenhead, G. S. & Ryan, A. G. (1992). The development of a new instrument: “Views on science-technology-society” (VOSTS). Science Education, 76 (5), 477-491. Also available at:
http://www.usask.ca/education/people/aikenhead/vosts_2.pdf
Akerson, V. L., Abd-El-Khalick, F. & Lederman, N. G. (2000). Influence of a reflective explicit activity-based approach on elementary teachers' conceptions of nature of science. Journal of Research in Science Teaching, 37 (4), 295-317.
Alters, B. J. (1997a). Whose nature of science? Journal of Research in Science Teaching, 34 (1), 39-55.
Alters, B. J. (1997b). Nature of science: a diversity or uniformity of ideas? Journal of Research in Science Teaching, 34 (10), 1105-1108.
Bell, R.L., Lederman, N. G. & Abd-El-Khalick, F. (2000). Developing and acting upon one's conception of the nature of science: A follow-up study. Journal of Research in Science Teaching, 37 (6), 563-581.
Bratt, M. (1984). Further comments on the validity studies of attitude measures in science education. Journal of Research in Science Teaching, 21 (9), 951.
Breckler, S. J. (1994). A comparison of numerical indexes for measuring attitude ambivalence. Educational and Psychological Measurement, 54 (2), 350-365.
Bybee, R. W. (1987). Science education and the science-technology-society (S-T-S) theme. Science Education, 71 (5), 667-683.
Clough, E. E. & Driver, R. (1986). A study of consistency in the use of students’ conceptual frameworks across different task contexts. Science Education, 70 (4), 473-496.
Chaiken, S., Pomerantz, E. M. & Giner-Sorolla, R. (1995). Structural consistency and attitude strength. In R. E. Petty & J. A. Krosnick, Attitude strength. Antecedents and consequences (pp. 387-412). Mahwah, NJ: LEA.
Eagly, A. H. & Chaiken, S. (1993). The psychology of attitudes. Forth Worth TX: Harcourt Brace College Publishers.
Fraser, B. J. & Tobin, K. G. (Eds.). (1998). International handbook of science education. Dordrecht, Netherlands: Kluwer Academic Publishers.
Gardner, P. L. (1975). Attitude measurement: A critique of some recent research. Education Research, 17 (2)101-105.
Gardner, P. L. (1996). The dimensionality of attitude scales: a widely misunderstood idea. International Journal of Science Education, 18 (8), 913-919.
Gauld, C. F. & Hukins, A. A. (1980). Scientific attitudes: A review. Studies in Science Education, 7, 129-161.
Haladyna, T. & Shaughnessy, J. (1982). Attitudes towards science: A quantitative synthesis. Science Education, 66 (4), 547-563.
Hodson, D. (1985). Philosophy of science, science, and science education. Studies in Science Education, 12, 25-57.
Hofstein, A., Aikenhead, G. & Riquarts, K. (1988). Discussions over STS at the Fourth IOSTE Symposium. International Journal of Science Education, 10 (4), 357-366.
Kempa, R. (1986). Assessment in science. Cambridge: Cambridge University Press.
Laforgia, J. (1988). The affective domain related to science education and its evaluation. Science Education, 72 (4), 407-421.
Lederman, N. G. (1992). Students' and teachers' conceptions of the nature of science: A review of the research. Journal of Research in Science Teaching, 29 (4), 331-359.
Lederman, N. G., Wade, P. D. & Bell, R. L. (1998). Assessing the nature of science: What is the nature of our assessments? Science and Education, 7 (6), 595-615.
Manassero, M. A. & Vázquez, A. (1998). Opinions sobre ciència, tecnologia i societat. Palma de Mallorca, Spain: Conselleria d'Educació, Cultura i Esports.
Manassero, M. A. & Vázquez, A. (2002). Instrumentos y métodos para la evaluación de las actitudes relacionadas con la ciencia, la tecnología y la sociedad. Enseñanza de las Ciencias, 20 (1), 15-27.
Manassero, M. A., Vázquez, A. & Acevedo, J. A. (2001). Avaluació del temes de ciència, tecnologia i societat. Palma de Mallorca, Spain: Conselleria d'Educació i Cultura.
Manassero, M. A., Vázquez, A. & Acevedo, J. A. (2003). Cuestionario de Opiniones sobre Ciencia, Tecnología y Sociedad (COCTS). Princeton, NJ: Educational Testing Service. Also available at: http://www.ets.org/testcoll/.
Manassero, M. A., Vázquez, A. & Acevedo, J. A. (2004). Evaluación de las actitudes del profesorado respecto a los temas CTS: nuevos avances metodológicos. Enseñanza de las Ciencias, 22 (2), 299-312.
McComas, W. F. (Ed.). (2000). The nature of science in science education: Rationales and strategies. Dordrecht, Países Bajos: Kluwer Academic Publishers.
McComas, W. F., Almazroa, H. & Clough, M. P. (1998). The Nature of Science in Science Education: An Introduction. Science and Education, 7 (6), 595-615.
McComas, W. F., Clough, M. P. & Almazroa, H. (2000). The role and character of the nature of science in science education. In W. F. McComas (Ed.), The nature of science in science education: Rationales and strategies (pp. 3-39). Dordrecht, Netherlands: Kluwer Academic Publishers.
Munby, H. (1983). Thirty studies involving the “Scientific Attitude Inventory”: What confidence can we have in this instrument? Journal of Research in Science Teaching, 20 (2), 141-162.
Oliva, J. M. (1999). Algunas reflexiones sobre las concepciones alternativas y el cambio conceptual. Enseñanza de las Ciencias, 17 (1), 93-107.
Ormerod, M. B. & Duckworth, D. (1975). Pupils attitudes' to science: a review of research. Windsor, UK: NFER Publishing.
Petty, R. E. & Krosnick, J. A. (1995). Attitude strength. Antecedents and consequences. Mahwah, NJ: LEA.
Rubba, P. A. & Harkness, W. L. (1993). Examination of preservice and in-service secondary science teachers' beliefs about Science-Technology-Society interactions. Science Education, 77 (4), 407-431.
Rubba, P. A., Schoneweg-Bradford, C. S. & Harkness, W. L. (1996). A new scoring procedure for the Views on Science-Technology-Society instrument. Internacional. Journal of Science Education, 18 (4), 387-400.
Schibeci, R. A. (1983). Selecting appropriate attitudinal objectives for school science. Science Education, 67 (5), 595-603.
Schibeci, R. A. (1984). Attitudes to science: Un update. Studies in Science Education, 11, 26-59.
Shadish, W. R. (1995). The quantitative-qualitative debates: ‘Dekuhnifying’ the conceptual context. Evaluation and Program Planning, 18, 47-49.
Shrigley, R. L. & Koballa Jr., T. R. (1992). A decade of attitude research based on Hovland's learning model. Science Education, 76 (1), 17-42.
Smith, M. U., Lederman, N. G., Bell, R. L., McComas, W. F. & Clough, M. P. (1997). How great is disagreement about the nature of science: A response to Alters. Journal of Research in Science Teaching, 34 (10), 1101-1103.
Solomon, J. & Aikenhead, G. (Eds.). (1994). STS education: International perspectives on reform. New York: Teachers College Press.
Stahlberg, D. & Frey, D. (1990). Actitudes I: estructura, medida y funciones. In M. Hewstone, W. Stroebe, J. P. Codol y G. M. Stephenson (Dirs.), Introducción a la Psicología Social (pp. 149-170). Barcelona: Ariel.
Taber, K. S. (2000). Multiple frameworks? Evidence of manifold conceptions in individual cognitive structure. International Journal of Science Education, 22 (4), 399-418.
Tamir, P. (1998). Assessment and evaluation in science education. Opportunities to learn and outcomes. In B. J. Fraser & K. G. Tobin (Eds.), International handbook of science education (pp. 761-790). Dordrecht, Netherlands: Kluwer Academic Publishers.
Vázquez, A., Acevedo, J. A. y Manassero, M. A. (2004). Consensos sobre la naturaleza de la ciencia: evidencias e implicaciones para su enseñanza. Revista Iberoamericana de Educación, edición digital. Retrieved January 3, 2005, from: http://www.campus oei.org/revista/deloslectores/702Vazquez.PDF
Vázquez, A. & Manassero, M. A. (1995). Actitudes relacionadas con la ciencia: una revisión conceptual. Enseñanza de las Ciencias, 13 (3), 337-346.
Vázquez, A. & Manassero, M. A. (1997). Una evaluación de las actitudes relacionadas con la ciencia. Enseñanza de las ciencias, 15 (2), 199-213.
Vázquez, A. & Manassero, M. A. (1999). Response and scoring models for the “Views on Science-Technology-Society” instrument. International Journal of Science Education, 21 (3), 231-247.
Waks, L. J. & Prakash, M. S. (1985). STS education and its three step-sisters. Bulletin of Science, Technology and Society, 52 (2), 105-116.
Wareing, C. (1990). A survey of antecedents of attitudes toward science. Journal of Research in Science Teaching, 27 (4), 371-386.
Zeidler, D. L. (1984). Thirty studies involving the “scientific attitude inventory”: what confidence can we have in this instrument. Journal of Research in Science Teaching, 21 (3), 341- 342.
Ziman, J. (1994). The rationale of STS. Education is in the approach. In J. Solomon y G. Aikenhead (Eds.), STS education: International perspectives on reform (pp. 21-31). New York: Teachers College Press.
Please cite the source as:
Vázquez Alonso, A., Manassero, M. A. & Acevedo, J. A. (2005). Quantitative analysis of complex multiple-choice items in science technology and society: Item scaling. Revista Electrónica de Investigación Educativa, 7 (1). Retrieved month day, year from:
http://redie.uabc.mx/vol7no1/contents-vazquez.html