Revista Electrónica de Investigación Educativa
Vol. 7, No. 1, 2005
Equity Variation of Cognitive and Non-Cognitive
Outcomes of Middle School Education in Argentina
Rubén Alberto Cervini Iturre
racervin@infovia.com.ar
Departamento de Ciencias Sociales
Universidad Nacional de Quilmes
Salguero 2460, 5º Piso
Buenos Aires, Argentina
(Received: November 26, 2004;
accepted for publishing: January 29, 2005)
Abstract
The equity level and variations of cognitive and non-cognitive achievements are analyzed, in the mathematics and language subjects, at the end of middle school education in Argentina. It has been used, all the available data from the National Census at the Conclusion of Middle School Level 1988, (“Censo Nacional de Finalización del Nivel Secundario de 1988”) performed by the Culture and Education Ministry of that country.
The analyzed data is of about 116,894 students from about 2,062 schools. The model of lineal hierarchy or multilevel technique is used with three levels: students, schools and State. Objectives: To evaluate the effect of a set of factors of educational (in) equity, from cognitive and non-cognitive outcomes, the interschool variation from the effect of such factors and the consistency of institutional effectiveness. This study detects different variation levels of institutional (in) equity, depending on the kind of achievement inequity factor considered herein. Also sustains some variations of the institutional effectiveness degree, according to different kind of students and speaks of the implications of the findings.
Key words: School achievement, secondary education, educational inequality, school effectiveness, non-cognitive outcomes.
Introduction
In the present study, the educational inequity patterns in the cognitive and non-cognitive achievements of the middle school level were compared and determined. Special attention was paid to the difference degree among schools, according to their capacity to achieve equal distributions of such school achievements. With such purpose, the data of the National Census at the Conclusion of Middle School Level 1988, was analyzed.
From more than a decade ago, some international organisms have advocated for equity development, specially speaking, for higher equity on educational opportunities in the Latin-American region, (Latin -American and Caribbean Economic Commission [CEPAL] 1992). Recent legislation in Argentina widely reflects that concern. The Basic General Education main objective, established by the Education Federal Law (n° 24 .195) of 1993, is “to provide a common basic formation to all children and teenagers of the country, warranting the access, stay and promotion, and equal learning quality and achievements”(Art 15, clause a).
According to this formulation, the equity principle refers to educational expenditures (offer equality) as well as school results obtained by the students. One form to operate this equity concept is to estimate the association degree among educational achievements of the student and certain individual factors of inequity (social background, gender, ethnic group, etc.), proper task of the correlative quantitative methodologies. In this approach, the bigger the co-relationship among school outcome and those factors, the bigger the educational inequity degree will be. With this method is evaluated as well, the school distributive efficiency with respect to the students’ achievements. That is why; the tradition of studies about school efficiency (Coleman et al., 1966; Jencks et al., 1972) enrolls in the most general topic of educational equity.
The co-relational technique of lineal hierarchy models (multilevel), of recent development (Aitkin and Longford, 1986; Bryk and Raudenbush, 1992; Goldstein, 1995), has allowed to operate other aspects of the educational inequity concept, besides the simple correlation. Unlike the traditional methods (Ordinary Least Squares [OLS]), the multilevel analysis estimates with no slants the effect of “contextual” variations (Goldstein, 1995) of (in) equity that along with the effect of inequity individual factors, conform the total magnitude of inequity and allow us to know if the effect of equity factors varies inside the different aggregation levels (Lam, Wong and Ho, 2002; Nuttall, Goldstein, Prosser and Rasbash, 1989; Opdenakker and Van Damme, 2001; Sammons, Thomas and Mortimore, 1977; Schreiber, 2002).
Besides that, since the variation of each level is specified in coefficient terms of explanatory variables (Goldstein et al., 1998), it is possible to determine the equity factors effects, over that variation (Lee and Byrk, 1998; Schreiber, 2002). Besides that, it allows us to estimate in a non slant way, the possible interactions between the individual and contextual factors of equity (Lee and Byrk, 1998; Opdenakker and Van Damme, 2001) and the “remains” for different groups of students, specified by aggregation level (Lee and Byrk, 1998; Sammons, Thomas and Mortimore, 1997; Thomas, 2001). This last aspect constitutes the central point of the present paper.
Almost all the investigations about equity of educational outcomes have focused their attention on cognitive achievements. However, it is commonly accepted that the school “produces” non-cognitive outcomes as well. A few investigations have evaluated the differential effect of school units over these kinds of outcomes (Brookover, Beadly, Flood, Schweitzer and Wisenbaker, 1979; Knuver and Brandsma, 1993). From the review of those studies some relevant statements arise.
In first place, used concepts and indicators remarkably vary. Sometimes refer to school conducts measured through administrative records, as is discipline and attendance (Mortimore, Sammons, Stoll, Ecob and Lewis, 1988), or through questionnaires, as social integration in class or the relationship with professors (Opdenakker and Van Damme, 2000), the compromise on academic work or the school behaviors, that could affect the school success (Lee and Smith 1993). In other times it is about of attitudes, interests and auto-concepts with respect to different curricular areas and learning activities (Mortimore et al., 1988; Opdenakker and Van Damme, 2000) or more general social expectations, as future educational aspirations (Coleman, Hoffer and Kilgore, 1982).
In second place, very marked differences exist among inter-school variations, of the cognitive and non-cognitive outcomes. While such variation on cognitive outcomes is around the 20% in developed countries (Bosker y Witziers, 1996) and between the 30% and 60% in third world countries (Riddell, 1997); it reaches very inferior average values in the non-cognitive outcomes (around the 10%), and becomes practically inexistent when determined indicators are used (Opdenakker and Van Damme, 2000; Mortimore et al., 1988).1 In third place, outcomes may vary according to the researched education level (elementary or middle [secondary]) and the used analysis method.
Beyond all these statements, to consider non-cognitive variations (attitudes, values, beliefs, expectations) as “outcomes” of the action of the school is highly polemic. To demonstrate such a bond, not only measurements of “before - after” of each result spoken, are required, but also careful designs of investigation. With respect to this, it is likely to exist high institutional selectivity, the schools attract or select a determined kind of students, and therefore, students attitudes and perceptions “frequently are the expression of distinctive ways of school adaptation, mediated by extra-institutional pressures” (Nash, 2002, p 15), it is to say, they reflex the effect of the contextual after-school factors, as long as it cannot be proved that these attitudes were developed by the school. For co-relational studies that do not count with “before - after” measurements of non-cognitive outcomes, the only possible way to moderate this problem is the use of good relative measurements to after-school, individual and contextual factors, that are very likely to influence in a significant way over such results. Even though, in this kind of design is not recommended to infer as school effect the total of the residual inter-school variation specially when it is about non-cognitive results.
In the present study, there were explored and compared the efficiency of co-relational models of (in) equity, the institutional variations of the (in) equity, and the school consistency with respect to cognitive and non-cognitive outcomes, and from different group of students. A multilevel analysis was applied to the National Census at the Conclusion of Middle School Level 1988 data, realized by the Ministry of Culture and Education of Argentina.
I. Research Antecedents
Previous research about the same data basis, but limited about the mathematics efficiency (Cervini 2002, 2003a, 2003b, 2003c, 2004a), have indicated that the average efficiency of schools significantly vary; that is to say, the expected achievement from each student highly depend on the school he is attending. A high proportion of this variation is explained by the social background, gender, academic antecedents (repetition) and labor situation of the student.
The higher the parent education level is (cultural capital), and the access of the student and his family to services and long lasting goods (economic capital), and the availability of educational and cultural goods (objective cultural capital), the higher the Mathematics efficiency will be. On the contrary, as more hours the student dedicates himself to after school work, the lower his efficiency level will be. On the other hand, women and repetition students get by average lower efficiency levels, from those of men and not repeating students, respectively.
In spite of being defined at the student level, the effect of all these factors of educational (in) equity is mainly detected, by the descent of differences among schools (unexplained variation), behavior that is reflecting the high segmentation degree or institutional socioeconomic and academic selectivity.
Additional to the effect of individual factors of inequity, contextual effects exist. Thus for example, from two similar repeating students, you shall expect worse efficiency from the student that is in one school with bigger proportion of repetition students. This conclusion is also valid for the contexts defined by the hours of work, parent’s education level and the availability of cultural and educational welfare. That is why, the interschool variation of the average efficiency, not explained by the individual factors previously commented, abruptly falls when socio-cultural composition indicators of the school are considered.
The studies previously mentioned have also determined that the intensity of institutional (in) equity varies very significantly. The schools differ in capacity to compensate the effect of social origin, of gender or the academic antecedents of the student. The distance between the average efficiency from men and women, from repetition students and from the ones not repeating, from the hard working and not hard working, varies among schools. There are more “egalitarian” schools than other ones (Bryk and Raudenbush, 1992).
Indicators also detected that this inter-school variation is associated with (in) equity factors. The prediction capacity of these factors varies per school, according to the capital of cultural level of the student, his gender or repetition history. In general, exists a lower variation among schools, for students with lower socio-cultural status; but as this increases, also does it, the variation with no explanation. Thus, outcomes gotten by students of social background less beneficial (low cultural capital) will get closer to the expected average for that student in the school, than the students with a more beneficial social background with respect to their expected average.
On the other hand, the female disadvantage, is emphasized in less favorable contexts, socially or academically. Besides that, the expected average of the repeating students increases as their percentage number decreases, but their relative increase is inferior to the experienced by the not repeating students. Therefore, the efficiency distance due to academic antecedents of the student is emphasized as the socio-cultural and academic contexts become more beneficial.
Finally, the levels of socio-cultural inequity (ex: parents education) of the schools with the same compositions will be more similar among themselves with respect to the other schools. This is not a confirmed conclusion for the other factors of inequity, that is academic history, gender, and daily time of after schoolwork.
In a word, the previous analyses are:
They have allowed to identify the different aspects of inequity inside school outcomes: (a) the learning probabilities at middle school level are strongly bound to the educational institution studied; (b) the educational (in) equity works mainly through the socio-cultural segmentation of the institutional framework; (c) but, at the same time, schools differ with respect to the degree in which individual factors of inequity fall into the distribution of the learning and besides that, (d) schools performed more efficiently toward the students of higher social background, toward the males and to the ones not repeating grades; (e) the (in) equity of gender, repetition problem and “the objective cultural capital”, vary according context characteristics (Cervini, 2004b, p. 12).
However, all these statements refer exclusively to the result of a mathematics standardized test, then these cannot be extra polarized further to other cognitive outcomes, and not even at least to the non cognitive. Besides that, those studies didn’t interrogate about the consistency of school efficiency with respect to cognitive and non-cognitive outcomes, and with respect to other group of students. In the present paper we work on these two matters.
II. Specific Objectives
1. To determine and compare the effect (association) of a model of educational (in) equity factors over cognitive and non-cognitive outcomes, that is to say: Does predictive capacity of factors change according to the kind of school outcome?
2. To evaluate the interschool variation of the effect of the socio demographic factors over the school outcomes, this means: Does the incidence force of the factors vary among the schools?
3. To know the consistency of school effectiveness for different outcomes (cognitive and non cognitive) and different group of students, that is: Is it the same relative effectiveness degree of each school for each kind of outcome and for each kind of student? or Does it vary significatively?
III. Methodology
a) Data
The data come from Mathematics and Language standardized tests, and is a student’s questionnaire; all of them as a part of the National Census at the Conclusion of Middle School Level 1988, performed by the Culture and Education Ministry of Argentina. The instruments were for self-application. Students with information in all the criteria analyzed variations were included; schools with only high school or commercial2 orientation, and with valid information for 20 or more students. Under these conditions, the file is conformed by 116,894 students of about 2,062 schools of 20 states.3
b) Cognitive Criteria Variations
Are the scores, gotten by the student on standardized tests?
c) Non Cognitive criteria Variations
These variations come from the student’s questionnaire. The questions present a scale of multiple option answers of four points (Likert type). The analysis of the main component with varimax rotation was used for the identification of the constructors and selection of items. The used measurements consisted of a simple summing of the points of each question, previous inversion of sense when needed:
- Success: Future success expectation due to the school, with six items. For example: “according to the information learned at school, what degree of success will you have in your university studies?”.
- Professor: Perception of the student over interpersonal teacher-student relationship inside the classroom and teaching practice, with three items. For example: “How many of your teachers are willing to listen your concerns?”.
- Motivation: Motivation for mathematics, with six items. For example: “Mathematics is the subject where I am interested most”.
- Valuation: Importance given to the mathematics knowledge, with three items. For example: “I can use the topics I learned in mathematics, in my everyday life”.
d) Independent Variations
These are the individual characteristics of the student and of the school composition:
- The individual variations of the student refer to the family’s economic capital, family‘s cultural capital, gender, academic antecedents and daily hours of after-school work. These are defined as follows:
- Goods + services: Availability (Yes = 1; No = 0) from 14 of long lasting goods and home services.
- Parents education: sum of the father’s and mother’s level of education (14 points); 1 = none, and 7 = complete university. When the information of the father (mother) is missing, the value of the mother (father) is assigned.
- Books + didactics: Formed by:
- Books: Availability of books at home: 1= less than 10; 5 = more than 100.
- Didactics: Availability of books, cue cards, school writings: 1 = none; 2 = some; 3 = all.
- Procedure to conform books + didactics: Re-code books 1 = 0; 2 = 0.20; 5 = 0.80, and add it to didactic.
- Feminine: Women = 1; men = 0.
- Repeating student: 1 = student repeating at least once; 0 = student not repeating.
- Hours_work: Quantity of hours per day the student works; 0 = none; 1 = until 2 hours; 5 = 5 or more hours.
- The variations of school composition are the average or the percentage of the school in every individual variation of the student.
e) Brief Comments About Variations
Goods an services at home (economic capital) and the reached educational level by the parents (economical and cultural capital) have been extensively used as measurements for social background of the student in the social research, and in general, register a high association with school achievement. This is also the case of books at home (objective cultural capital) and school’s books and didactic materials. It was decided to use a summing combination for both of them, because the same had a predicting capacity above the one obtained when both indicators acted separately.
The gender differences in the mathematics achievements, is a topic recurrently investigated. Friedman (1989) in his revision of more than one hundred investigations, concludes that there are no differences between sexes, and if there is one, is in favor of women. At first years of middle school, some investigations inform several advantages for women (Tsai and Walberg, 1983), other for men (Hilton and Berglund, 1974) and other for none of them (Fennema and Carpenter, 1981). However at the end of the middle school, most of the investigations report advantages for men (Friedman, 1989).
Because we do not count with any other specific indicator for the antecedent level of academic achievement, the repetition episode is used as a proxy indicator.
Beyond some inconsistencies (Quirk, Keith y Quirk, 2002), the investigation coincides that the after-school work effect over the academic performance depends on the work-hours. In general, negative effects are detected when dedication to work surpasses from 15 to 20 weekly hours (Cooper, Valentine, Nye and Lindsay, 1999; Kablaoui and Pautler, 1991; Marsh, 1991; Steinberg and Kaufman, 1995; Steinberg and Dornbush, 1991). Some longitudinal studies have also been concurring with that conclusion (Mortimer, Finch, Ryu, Shanahan and Call, 1996; Quirk, Keith and Quirk, 2002; Singh, 1998).
The most acceptable interpretation is that as long as work hours increase, “the opportunity to learn” diminishes (Carroll, 1963), one of the most important conditioners for level efficiency.4 However, this reasoning should be relative. A review of investigations showed that the involved students in extra - curricular activities (as sports) have higher achievements (Holland and Andre, 1987), a conclusion that has been confirmed by more recent investigations (Marsh, 1992; Gerber, 1996).
The measurements for non-cognitive outcomes are heterogeneous. Two of them, motivation and valuation, are attitudes in front of mathematics knowledge, traditional and extremely researched area. The professor measurement refers to certain school characteristics, persistently considered by the investigations about school efficiency, such as the cordiality and availability the teacher shows to student (Moos, 1987), the quality of student/teacher relationship (Power, Higgins and Kohlberg, 1989), the corrective teaching (Creemers, 1994) and the effective time for learning (Scheerens and Bosker, 1997).
In the other hand, the success variation “is an evaluation of school experience in general or a perception of the educational opportunities given by the school” (Power, Higgins and Kohlberg, 1989).
f) Technical Analyses
For the analyses of the relationship between the efficiency and the different variations the MLwiN program was used (Goldstein et al., 1998), based in the statistical analyses method by multiple levels or lineal hierarchy models (Aitkin and Longford, 1986; Byrk and Raudenbush, 1992; Goldstein, 1995). The data allows you to define models with three grouping levels: the student (level 1), the school (level 2), and the state (level 3). This last level is included with the purpose of not over estimate the inter-school variation, center of interest in this work.
g) Models and Analysis Strategy
The analysis was developed in three stages, corresponding to the proposed objectives:
1) The effect of the factors of inequity over the cognitive and non-cognitive outcomes. At this stage the sequence of analysis responded to the criteria of distinguish and determine the effects of the socio-demographic characteristics of the individual student, his academic antecedents, the school socio-demographic context, and the academic composition of the school. The measurements of factors of individual (in) equity described above were adapted and which efficiencies with respect to the achievement in Mathematics has been evaluated in another work (Cervini, 2004b). The general adjusted empiric model is expressed as follows:
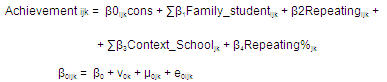
Where:
Achievement ijk is the score obtained in cognitive tests (Mathematics or Language) or non cognitive, by the student i, in the school j, in the state k.
 is a set of parameters, to be estimated, that expresses the relation between the achievement and some socio-economic and cultural characteristics of the family, the quantity of daily work hours and the gender of the student (average difference between the achievements of men and women),
 is a set of parameters, that tells the average difference between the achievements of repeating and not repeating students.
 is a set of parameters to be estimated and that express the relationship between the achievement and some socioeconomic and cultural characteristics of the context (socioeconomic composition) of the student’s school.
 is a parameter, that expresses the relation between the achievement and the amount of repeating students in the school;
cons is a constant =1.
 is an associated parameter to cons with
  of average achievement estimated (permanent part).
 and
and  are “remains” at state, school and student level respectively; aleatory quantities not correlated, normally distributed with the half + 0 and which respective variations (
 and
and  ) should be estimated again.
As illustration mode, the model that only includes the socio-demographic characteristics of the individual student is expressed as follows:
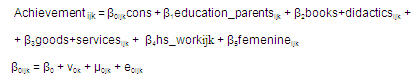
Where: Achievement ijk is the score gotten in cognitive tests (Mathematics or Language) or non cognitive, by the student i , in the school j, or in the state k.
 are parameters to be estimated and express the degree the differences between the students with respect to parents education, book+didactics, goods+services and daily work hours, respectively, are related with the mathematics achievement.
 expresses the average difference between the men and women achievement.
cons is a constant = 1 and  is an associated parameter to cons, with
  as an estimated average achievement (permanent part).
 and e0ijk are remains at state, school, and student level respectively, are aleatory amounts, not correlated, normally distributed with half=0 and which respective variations (
 and
and  ) should be estimated again.
From this model on, the repetition antecedent of the student is incorporated (repeating student), the school’s socio-demographic context, and the school‘s academic composition. This sequence of modeling is realized for each one of the criteria-variation. Since the objective is to evaluate the magnitude of the effect of these models of school (in) equity factors, the analysis is centered in the decrease of the magnitude of the not explained remains at school level, without paying attention to possible co-lineal problems between the factors, nor trying to identify a depurated final model and more parsimonious.
1) Aleatory: Is the analysis about variation of the effect of educational (in) equity factors at school level.
2) Institutional Consistency: Is the analysis of the variation of school efficiency by kinds of results and by group of students, based in the correlation of remains at school levels.
Since the criteria variations are expressed at different scales, and with the purpose to ease the comparison of results, all of them have been standardized. The setting of the different models is evaluated with the test of maximum credibility.5
IV. Results
Results are presented according to the proposed objectives and the adopted analysis strategy. In every point is briefly explained the realized procedure.
a) Effect of Inequity Factors
Table I presents the estimations of the not explained variations (remains) in each aggregated level (student, school State) for all the analyzed models.
Table I. Percentage distribution of the variation, by (cognitive and non cognitive) outcomes, by aggregation levels, is according regression models
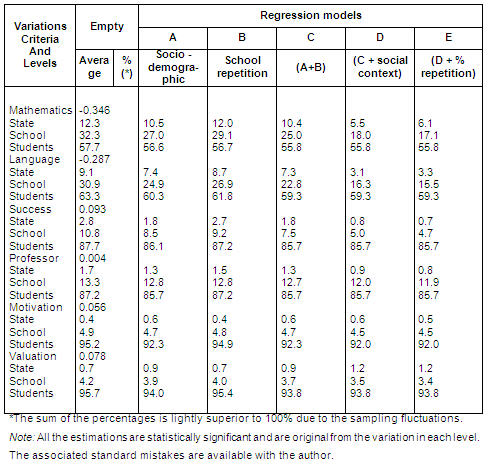
Empty model (“null” or unconditional): It is the initial distribution of the variation of each criteria-variation in the three levels of aggregation and with out any predictor. Estimates the global media (permanent part) and, simultaneously, the variation (%) in each aggregation level (State, school and student), (aleatory part). In this way for example, the media estimated for Mathematics is -0.346, from which 12.3% of the total variation around it, corresponds to the variations of the stately media with regard to the global media, the 32.3 % corresponds to the variation of the average of the schools with regard to the average of the State they are part of (inter school variation) and the 57.7% corresponds to the efficiencies variation of the students with regard to the average efficiency of the school they are part of (inter school variation).
All the inter school variations are statistically significant. Schools differ among themselves with regard to the results their students obtain, being cognitive or non cognitive. However, is about the first ones that the educational institution is more associated -that is around the third part of the total variation from both efficiencies-.
On the other hand, that variation is about 11 to 13% when it is about a future expectation or about the student - teacher relationship and lower than 5% in the case of motivation and the Mathematics valuation.
In contrast, only the cognitive achievements differ significantly from the State and, as a consequence, the “among-student” (inter school) variations of the non cognitive, reach much higher values than the observed in the cognitive. In general, this is a reasonable distribution, since the cognitive outcomes owe more to the school than the non-cognitive, bound closely to the family origin and context.
As a summary, if the effect of the institutional grouping of the students is manifestly stronger in the cognitive outcomes, the non cognitive outcomes referred to the general socio educational attitudes, also show an important relationship toward that grouping criteria. Then, the students will get higher or lower efficiencies, success expectations and perceptions of their relation with the professors, depending on the school they attend. This guessing is emphasized when referring to the specific attitudes about mathematics.
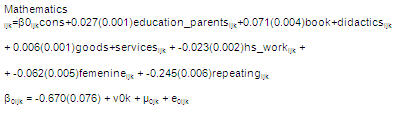
- Model A. All student individual variations referred to socio demographic characteristics, are simultaneously added in the “empty” model. As an example of this operation, the Mathematics outcome is as follows:
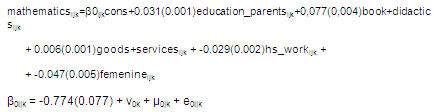
These outcomes confirm previous studies indicating a narrow co-relationship of these factors with the Mathematics efficiency (Cervini 2002, 2003a). Women obtain, by average, lower efficiency levels than men. The three measurements referring to the student’s socio cultural background maintain its own positive effect; therefore, the higher the parents educational level is and/or the access of the student to long lasting goods and services (economic capital), and/or the availability of cultural and educational goods, the higher the Mathematics efficiency will be. Finally, the estimation of work hours effect and its negative sign (-0.029) indicates that as more hours the student works, lower his efficiency level will be. The estimation of the effect of each one of these variations, is significantly higher (p<0.001). This set of individual variations produces a slight attenuation of the “among-student” variation inside school (from57.7 to 56.6), meanwhile the effect about inter school variation is above the 16%.
The explanatory capacity of these (in) equity factors is clearly stronger in the cognitive outcomes than the non-cognitive, and among these, its higher association is with the success sense. The higher effect is detected at the difference level among schools and not among students, reflecting segmentation level or institutional selectivity by socio-cultural characteristics of the student.6
- Model B: the dummy variation (repeating student) is included alone in the empty model. This operation produces a statistically significant decrease of the variation at school level in all the analyzed criteria-variations. Then the Mathematics and Language efficiencies, the future success expectations, (the perception of) the relation toward professors, motivation and valuation of Mathematics of repeating students, will be lower than their not repeating colleagues. However, the magnitude of the remains at school level of this model is in general, superior than the one left by Model A. Therefore, the magnitude of the effect produced by repetition is lower to the one produced by integrated variations to such model.
- Model C: in this stage the socio demographic variations and the school repetition are simultaneously included. The estimations indicate that cognitive outcomes and success expectation are effectively school (in) equity factors; that is to say, the school repetition adds a significant portion to the explanation of the variation of those criteria-variations. Then, for example, for Mathematics efficiency case, the outcomes are as follows:
In contrast, with motivation, valuation, and professor, the estimations of this model are very similar to the Model A.
• Model D: The composition variations (aggregation of socio-demographic variations at school level) are included in the previous model, operation that allows to detect the existence of “context-effect”. For the mathematics, language and success variations, such effect is notorious in the inter-school variation decrease, not explained in about the 30%. For example: in Mathematics, the relative decrease is of about 28% [(25.0 - 18.0)/ 25.0*100]. The explanatory level is not observed in none of the remaining non-cognitive outcomes.
• Model E: The percentage (%) of repeating students in the school, is added. A decrease in the inter-school variation is registered, only with respect to the cognitive and success outcomes.
In relative terms, this succession of models is clearly more efficient with the cognitive outcomes than with the non-cognitive, except in the success. In fact, the interschool variation in the empty models of mathematics, language and success has decreased a 50 % in the Model E, a very different change from the one experimented by the remaining non cognitive results. From the initial total variation, these models have explained approximately a quarter in the case of the of the cognitive outcomes, 10% of (success) and not more than 3.7% from the remaining cognitive.
b) Aleatority
In the previous models, it was supposed that the intensity of the association between the criteria-variable and each one of the individual factors, was similar in all the schools; however, it might change. In order to evaluate this possibility, it has to be allowed that such correlation varies at school level (aleatority). With the purpose of simplifying the analysis, you make a model only of the variation of each effect, maintaining all the co-variations of the diverse effect fixed among themselves, and from these ones with the average efficiency of the school (intercept). The purpose is to know whether the force of incidence of these factors varies among the schools. On Table II, the statistical meaning of the variations is indicated (level 2) of each factor for each criteria-variation.7
Table II. Statistical meaning of the aleatory variation (school level) of each factor of inequity, according to school outcomes
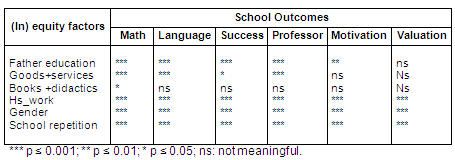
Most of the aleatory effects at school level vary meaningfully. The distances between men and women, repeating-not-repeating ones, and working-not-working, vary meaningfully in all the school outcomes. On the other hand, the effects of father-education and goods+services do not vary among the schools when speaking about motivation and about Mathematics valuation. The showiest outcomes are the stability of the effect of the possession of books and didactics books+didactics with respect to all the studied school outcomes.
c) Institutional Consistency
In this step is evaluated: (1) the consistency of school effectiveness for the different considered outcomes (cognitive and non-cognitive), and (2) for different group of students. In both cases, the evaluation criteria is the correlation between school level remains (level2), “adjusted” with Model D:
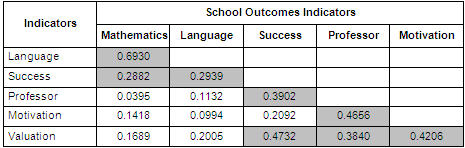
1. Consistency by school outcomes. It is about knowing if the schools are equally effective with respect to cognitive and non-cognitive outcomes (Table III). The most of the consistency is registered among academic outcomes; however, the estimated coefficient (=0.69) indicates that, in a big part, school efficiency varies according to the considered curricular area. The schools with most effect over mathematics achievement are not necessarily the ones having more effect over language achievement. On the other hand, the correlations rank among non-cognitive outcomes, is from 0.38 to 0.47, close correlations among themselves, but yet much lower than the previous one. Finally, the relationships among cognitive and non-cognitive outcomes are clearly low (in a rank from 0.04 to 0.29), and mark a high consistency of school effectiveness with respect to these two kinds of outcomes.
Table III. - Correlation Coefficients (r-Pearson) among remains (school level) from school outcomes, fixed by Model D
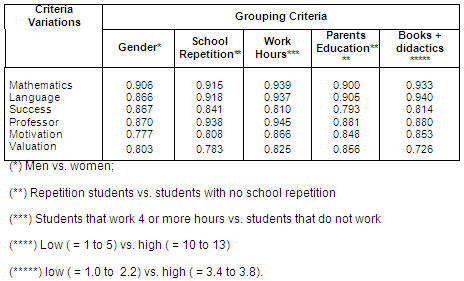
2. Consistency by students group. The purpose is to establish the existence of un-even grades of efficiency for different kinds of students, defined with a base in some factors of individual (in) equity. This procedure consists on estimating the co-relationships of the adjusted remains (Model D) of the group of students defined with base in the gender, school repetition, parents education, work hours, and possession of books and didactic materials (se definition on Table IV).
Do not exist perfect co-relation of efficiency for different groups of students (Table IV). The most consistency evidence corresponds to the cognitive outcomes, particularly in the group of students categorized according to the after-school labor activity, books possession and didactic material. The evidence of lowest consistency of efficiency with respect to cognitive outcomes is registered in the remains of Language for men and women. Among the non-cognitive outcomes, the high consistency among repeating- not-repeating students and working -not- working students, are noticeable with respect to (perception of the) relationship with the educators (professors).
Meanwhile, strong inconsistencies appear in the non-cognitive outcomes as motivation for mathematics between men and women or the valuation of mathematics among possessors and not-possessors of cultural objective capital (books and didactics material).
Table IV. Co-relation Coefficients (r-Pearson) among remains (school level) adjusted to Model D by school outcomes and according to group of students
V. Conclusions
In this works are explored the effects of the grouping of students in the schools, about diverse cognitive and non-cognitive outcomes. The data informed that the variation of the average cognitive achievements of the schools, is notoriously more important than the relative to the average value of the non- cognitive variations. This outcome is generally concurring /compatible with the international revised literature. The school grouping affects differently the cognitive and non-cognitive outcomes. They behave as different school outcomes.
By the other hand, the magnitude of the school effect over the non-cognitive outcomes notoriously varies in relation to the studied aspect. According with the analyzed data, the school differ very little among themselves with respect to non-cognitive indicators specifically referred to mathematics (motivation and valuation) and more emphasized with respect to other kind of indicators referring to the school valuation, generally (success sense) as particularly (relationships with school educators).
The explanatory capacity of the studied inequity factors (social background, gender, repetition), individual and contextual, is meaningfully bigger with the cognitive indicators than with the non-cognitive. The only exception is the “success sense” strongly affected by such factors. In all the cases, that effect is mainly manifested through an important reduction of the inter school variation, behavior that reflects the socio-economic segmentation of the educational system. Therefore, the initial variations among students, that is, inside schools, remain in a big part, with no explanation. This is more notorious in the non-cognitive outcomes relative to motivation and valuation of the mathematic knowledge, this is, attitudes with respect to specific curricular contents.
The schools differ among themselves with respect to their “egalitarian” capacity in front of the effect to different factors of inequity. The exceptions to this general tendency are related to the effect of social background of the student (parents education, and goods and services at home) over the attitudes in front mathematics, which is not meaningfully varying among schools.
Then, in this aspect, all schools would be equally (un) egalitarian.
On the other hand, the effect of the access to cultural objective capital (books and didactics) over each one of the outcomes, do not vary among schools. It seems that, do not exist pedagogic nor institutional practices that produce re-distributive advantages in front of this inequality among students.
Schools are little consistent with respect to the efficiency to obtain different outcomes with their students. The correlations among the performance of the schools in the different studied outcomes, measured by the “adjusted” remains, are notoriously low. Yet, the strongest -Mathematics vs. Language- indicates that the cognitive outcome gotten for any school in a determined curricular area cannot be used to predict in a relying way the outcome that will be obtained in some other area of the same kind. The predictions of non-cognitive outcomes departing from cognitive outcomes, and even from the non-cognitive among themselves, will be less relying.
The egalitarian capacity of the school with respect to determined kinds of students, is heterogeneous, fluctuating and depends on the kind of considered outcome.
Generally, the higher consistencies are verified with the cognitive outcomes (r : 0.87 - 0.94), but are not perfect correlations. The lowest among them, implies that the relative outcome in Language, obtained by the feminine students of any ordinary school and adjusted by the equity factors, cannot be used to predict with out an important error fee, the relative outcome obtained by the male students of that same school. That same conclusion is elongated for almost the total of the consistencies among group of students that were explored. Therefore, the integral schools where the pedagogic actions have egalitarian effects, in all the aspects (cognitive and non-cognitive) of the learning and with respect to different group of students, are the less frequent. The institutional equity must be evaluated with a multidimensional focus, attending the most quantity of possible aspects in the school outcomes.
References
Aitkin, M. & Longford, N. (1986). Statistical modelling issues in school effectiveness. Journal of the Royal Statistical Society, A, 149, 1-42.
Bosker, R. J. & Witziers, B. (1996, abril). The magnitude of school effects or: Does it really matter which school a student attends? Paper presented at Annual Meeting of the American Educational Research Association, New York.
Brookover, W., Beady, C., Flood, P., Schweitzer, J., & Wisenbaker, J. (1979). Schools, social systems and student achievement. Schools can make a difference. New York: Praeger.
Bryk, A. & Raudenbush, S. (1992). Hierarchical Linear Models for Social and Behavioral Research: Applications and Data Analysis Methods. Newbury Park, CA: Sage.
Carroll, J. (1963). A model of school learning. Teachers College Record, 43 (8), 723-733.
Comisión Económica para América Latina y el Caribe. (1992). Educación y conocimiento. Eje de la transformación productiva con equidad. Santiago, Chile: Author.
Cervini, R. (2002). Desigualdades socioculturales en el aprendizaje de matemática y lengua de la educación secundaria en Argentina: Un modelo de tres niveles. Revista Electrónica de Investigación y Evaluación Educativa, 8 (2). Retrieved October 12, 2004, from: http://www.uv.es/RELIEVE/v8n2/RELIEVEv8n2_1.htm
Cervini, R. (2003a, February 10). Diferencias de resultados cognitivos y no-cognitivos entre estudiantes de escuelas públicas y privadas en la educación secundaria de Argentina: Un análisis multinivel. Education Policy Analysis Archives, 11. Retrieved October 12, 2004, from: http://epaa.asu.edu/epaa/v11n6/
Cervini, R. (2003b). Relaciones entre composición estudiantil, proceso escolar y el logro en matemáticas en la educación secundaria en Argentina. Revista Electrónica de Investigación Educativa, 5 (1). Retrieved October 12, 2004, from: http://redie.ens.uabc.mx/vol5no1/contenido-cervini2.html
Cervini, R. (2003c). La eficacia educativa del sector público. El caso de las escuelas secundarias técnicas en Argentina. Revista Latinoamericana de Estudios Educativos, 33 (3), 53-92.
Cervini, R. (2004a). Influencia de los factores institucionales sobre el logro en matemática de los estudiantes en el último año de la educación Media de Argentina. Un modelo de tres niveles. Revista Electrónica Iberoamericana sobre Calidad, Eficacia y Cambio en Educación, 2 (1). Retrieved October 12, 2004, from: http://www.ice.deusto.es/rinace/reice/vol2n1/Cervini.pdf
Cervini, R. (2004b, October 12). Nivel y variación de la equidad en la educación media de Argentina. Revista Iberoamericana de Educación, 34 (4). Retrieved December 10, 2004, from: http://www.campus-oei.org/revista/deloslectores/844Cervini.PDF
Coleman, J., Campbell, E., Hobson, C., MacPartland, J., Mood, A., Weinfeld, F., et al. (1966). Equality of educational opportunity. Washington, DC: Government Printing Office-US Department of Health, Education and Welfare, Office of Education.
Coleman, J., Hoffer, T., & Kilgore, S. (1982). High school achievement: Public, catholic and private schools compared. New York: Basic Book.
Cooper, H., Valentine, J. C., Nye, B., & Lindsay, J. J. (1999). Relationships between five after-school activities and academic achievement. Journal of Educational Psychology, 91 (2), 369-378.
Creemers, B. (1994) Effective instruction: An empirical basis for a theory of educational effectiveness. In D. Reynolds, B. Creemers, P. S. Nesselrodt, E. C. Shaffer, S. Stringfield, & C. Teddlie (Eds.), Advances in school effectiveness research and practice (pp.189-203). Oxford: Pergamon.
Fennema, E. & Carpenter, T. P. (1981). Sex related differences in mathematics: Results from national assessment. Mathematics Teacher, 74 (7), 554-559.
Fraser, B. (1989). Twenty years of classroom climate work: Progress and prospect. Journal of Curriculum Studies, 21 (4), 307-327.
Friedman, L. (1989). Mathematics and the gender gap: A meta-analysis of recent studies on sex differences in mathematical tasks. Review of Educational Research, 59 (2), 185-213.
Gerber, S. (1996). Extracurricular activities and academic achievement. Journal of Research and Development in Education, 30 (1), 42-50.
Goldstein, H. (1995). Multilevel statistical models. London, UK: Edward Arnold.
Goldstein, H., Rasbash, J. Plawis, I., Draper, D., Browne, W. Yang, M., et al. (1998). A user guide to MlwinN. London, UK: University of London.
Hilton, T. L. & Berglund, G. W. (1974). Sex differences in mathematics achievement: A longitudinal study. The Journal of Educational Research, 67 (5), 232-237.
Holland, A. & Andre, T. (1987). Participation in extracurricular activities in secondary school: What is known, what needs to be known? Review of Educational Research, 57 (4), 437-466.
Jencks, C. L., Smith, M., Acland, H., Bane, M. J., Cohen, D. K., Gintis, H., et al. (1972). Inequality: a reassessment of the effects of family and schooling in America. New York: Basic.
Kablaoui, B. N. & Pautler, A. J. (1991). The effect of part-time work experience on high school students. Journal of Career Development, 17 (3), 195-211.
Knuver, A. & Brandsma, H. (1993). Cognitive and affective outcomes in school effectiveness research. School Effectiveness and School Improvement, 4 (2), 189-204.
Lam, R., Wong, K. C., & Ho, L. M. (2002). School effectiveness of a streamed-school system: A multilevel modelling of the Hong Kong secondary schools. Australian Journal of Education, 46 (3), 287-304.
Lee, V., & Bryk, A. (1998). A multilevel model of the social distribution of high school achievement. Sociology of Education, 62 (3), 172-192.
Lee V. & Smith, J. (1993). Effects of school restructuring on the achievement and engagement of middle-grade students. Sociology of Education, 66 (3), 164-187.
Marsh, H. W. (1991). Employment during high school: Character building or a subversion of academic goals? Sociology of Education, 64 (3), 172-189.
Marsh, H. W. (1992). Extracurricular activities: Beneficial extension of the traditional curriculum or subversion of academic goals? Journal of Educational Psychology, 84 (4), 553-562.
Moos, R. (1979). Evaluating educational environments. Washington, DC: Jossey-Bass.
Moos, R. (1980). Evaluating classroom learning environments. Studies in Educational Evaluation, 6 (3), 239-252.
Moos, R. (1987). The social climate manual (2a. ed.). Palo Alto, CA: Consulting Psychologists Press.
Mortimer, J. T., Finch, M. D., Ryu, S., Shanahan, M. J., & Call, K. T. (1996). The effects of work intensity on adolescent mental health, achievement, and behavioral adjustment: New evidence from a prospective study. Child Development, 67 (4), 1243-1261.
Mortimore, P., Sammons, P., Stoll, L., Ecob, R., & Lewis, D. (1988). The effects of school membership on pupils' educational outcomes. Research Papers in Education, 3 (1), 3-26.
Nash, R. (2002). Peer effects and peer group processes: Joining the conversation on quantitative and qualitative methods. Australian Journal of Education, 46 (1), 6-18.
Nuttall, D., Goldstein, H., Prosser, R., & Rasbash, J. (1989). Differential school effectiveness. International Journal of Educational Research, 13 (7), 769-776.
Opdenakker, M. & Van Damme J. (2000). Effects of schools, teaching staff and classes ion achievement and well-being in secondary education: similarities and differences between school outcomes. School Effectiveness and School Improvement, 11 (2), 165-196.
Opdenakker, M. & Van Damme, J. (2001). Relationship between school composition and characteristics of school process and their effect on mathematics achievement. British Educational Research Journal, 27 (4), 407-432.
Power, F., Higgins, A., & Kohlberg, L. (1989). Lawrence Kolberg’s approach to moral education. New York: Columbia University Press.
Quirk, K.; Keith, T., & Quirk, J. (2002). Employment during high school and student achievement: Longitudinal analysis of national data. The Journal of Educational Research, 95 (1), 4-10.
Ridell, A. (1997). Assessing designs school effectiveness research and school improvement in developing countries. Comparative Education Review, 41 (2), 178-204.
Sammons, P., Thomas, S., & Mortimore, P. (1997). Forging link: Effective schools and effective departments. London, UK: Paul Chapman Publishing.
Scheerens, J. & Bosker, R. (1997). The foundation of educational effectiveness. Oxford: Pergamon.
Schreiber, J. B. (2002). Institutional and student factors and their influence on advanced mathematics achievement. The Journal of Educational Research, 95 (5), 274-286.
Singh, K. (1998). Part-time employment in high school and its effect on academic achievement. The Journal of Educational Research, 91 (1), 31-139.
Steinberg, L. & Dornbush, S. M. (1991). Negative correlates of part-time employment during adolescence: Replication and elaboration. Development Psychology, 27 (2), 304-313.
Steinberg, L. & Kaufman, E. (1995). The impact of employment on adolescent development. Annals of Child Development, 11 (1), 131-166.
Tagiuri, R. (1968). The concept of organizational climate. In R. Tagiuri & G. H. Litwin (Eds.), Organizational climate: Exploration of a concept. Boston, MA: Harvard University, Graduate School of Business Administration, Division of Research.
Thomas, S. (2001). Dimensions of secondary school effectiveness: Comparative analyses across regions. School Effectiveness and School Improvement, 12 (3), 285-322.
Tsai, S. L. & Walberg, H. J. (1983). Mathematic achievement and attitude productivity in junior high school. The Journal of Educational Research, 76 (5), 267-272.
Translator: Lessie Evona York-Weatherman
UABC Mexicali
1 For example, Mortimer et al. (1988) find the next variations: school attending, 5.6%; auto-concept, 8.4% and attitudes in front to mathematics, 12.2%. In Opdenakker and Damme (2000), the total inter-institutional variation (school-classroom) is of about the 5% in motivation and auto-concept, and has about the 10% in social integration and relationship with the professor (p. 175). Both studies apply multilevel analysis.
2 The technical schools are not included in the analysis because they have important curricular differences with other modalities (See Cervini, 2003b).
3 For the analysis, the State of Buenos Aires is divided in “Gran (Great) Buenos Aires” (urban) and the rest of the State. During the relay, the next States: Cordoba, Entre Ríos, Formosa, La Pampa y La Rioja, were not included.
4 For the Argentina’s case see Cervini (2001).
5 The adjustment degree (probability) of a model is estimated basing the differences between the values of the highest credibility rank, from the analyzed model and from the previous model, difference that can be referred to the distribution of chi2 and which grades of freedom are defined by the quantity of new parameters that have been adjusted in the analyzed model.
6 Generally, it is expected that the variables affect mainly the level variations they are defined in. Then, for example, the individual variables of the student should affect principally the variation of student level. However, when the composition of the groups (school) with respect to the individual explanatory variables, is not the same for all of them, there will be a fall in the variation of those groups level (interschool). Then, the explanatory variables of individual level (student) will explain part of the individual variation and part of the group variation.
7 The standard estimations and mistakes are available with the author.
Please cite the source as:
Cervini, R. A. (2005). Equity Variation of Cognitive and Non-Cognitive Outcomes of Middle School Education in Argentina. Revista Electrónica de Investigación Educativa, 7 (1). Retrieved month day, year from:
http://redie.uabc.mx/vol7no1/contents-cervini3.html