Revista Electrónica de Investigación Educativa
Vol. 6, No. 2, 2004
Evaluation of High Schools
in the Basque Autonomous Community
José Francisco Lukas Mujika
(*)
plplumuj@sf.ehu.es
Karlos Santiago Etxeberria
(*)
plpsaetc@sf.ehu.es
*
Departamento de Métodos de
Investigación y Diagnóstico en Educación
Facultad de Filosofía y Ciencias de la Educación
Universidad del País Vasco
Avenida de Tolosa, 70
San Sebastián - 20.018
Gipuzkoa, España
(Received: December 30, 2003;
accepted for publishing: March 10, 2004)
Abstract
The objective of this paper is to present the high school evaluation model being applied in the Basque Autonomous Community (Spain). This has the purpose of offering relevant information for establishing processes of change and institutional improvement in each of the participating schools. It analyzes, on the one hand, the theoretical bases that underlie it, and on the other, the more relevant methodological and technical aspects of this experience. Together with the description, there is presented a detailed description of the dimensions analyzed, as well as of the collection and construction of the tests and questionnaires used, the current situation and the perspectives for the future.
Key words: Evaluation of schools, high school education, formative evaluation.
Need for the evaluation of schools
Today, the assessment of schools is an important area of evaluation. However, until a few decades ago, there was not as much interest in it as there is today, and that has been due to several reasons. First, we must cite the famous reports of Coleman et al. (1966) and Jencks et al. (1972), who demonstrated that the socio-cultural and economic background of students conditioned their subsequent performance. However, the fact remains that subsequent research found that students with similar backgrounds, but who attended different schools, obtained a different achievement. That is, there was discovered another factor that could explain some of the differences between the students and what was called the school effect. However, there are other reasons that have contributed to causing the administrators, educators and researchers to focus their attention on the school (Pérez Juste, 1999, Tiana, 1999, Lukas, Santiago, Munarriz, Moyano and Sedano, 2000); such as:
- The need for information that shows the society both in connection with the education system in general and with each school in particular.
- The idea that the school will contribute to improving the quality of education.
- Increased school autonomy that takes accountability into consideration.
The evaluation of schools is a very complex task, above all, in practice, due to technical reasons, environmental pressures, lack of qualified assessors, and difficulties in obtaining the participation and collaboration needed (Escudero, 1997). Evaluating a school is supposed to answer three fundamental questions, namely: “What do we want to evaluate? How are we going to do it?” and “Why are we are going to evaluate?” (De Miguel, 1997).
The following is the model known as NETWORKS, which has been set in action in the Basque Country for the external evaluation of compulsory high schools (CHS).
Implementation of the NETWORKS model in the Basque Country
In 1996, a group of teachers from the high schools and the college of the Community of Madrid decided to create a network for the external evaluation of the CHS, as a contribution to them. This evaluation network was to have a perspective different from what, up to that time, had developed in Spain (Marchesi, 2002). The decision was based on three reasons:
- The lack of a tradition for evaluation centers in Spain.
- The belief that it was positive to offer a new evaluation model which would complement those already in use, and would offer a viable alternative. The evaluation models put into practice were formative in nature, and combined external and internal evaluation; positive characteristics, but which used very few tests and quantitative instruments, and rejected the possibility of providing contextualized and comparative data. The new model is an attempt to overcome these limitations without falling into a reductionist and hierarchical evaluation of the schools.
- The consideration that a balanced evaluation could be a powerful instrument for change and improvement.
In 1999 the evaluation team, with funding from the Santa Maria Foundation, created the Institute of Educational Evaluation and Consultation (IDEA, for its initials in Spanish), organized in a decentralized manner and having several offices in different autonomous communities, including those of the Basque Country.
The evaluation began in the academic year 1999-2000 in the Basque Country, and has since involved 55 compulsory high schools (for young people 12-16 years of age). As noted previously, it was promoted and funded by the Department of Education of the Basque Government, and the faculty of the University of the Basque Country is in charge of putting it into practice.
In the agreement signed between the IDEA and the University of the Basque Country there was contemplated an evaluation plan for four consecutive courses. At the same time in other Spanish autonomous communities (Catalonia, Madrid, Andalusia, etc.), there was being implemented the same of evaluation plan. This would give the opportunity to obtain benchmark scores for different regions.
Evaluation Objective
The aim was for each of the participating schools to obtain information about its operation and its results, which would enable them to make decisions they deemed appropriate for improving their own performance and the performance of their students. More specifically, it was intended for each of the schools to know, in the broadest possible manner, what their situation was in the different aspects evaluated; what the progress of their students was, taking as reference the indicators of the schools of their same sociocultural context; and to get a view of their own changes. Ultimately, the key to this assessment was to help in schools set up internal processes for improvement. To accomplish this, they had to know the way they functioned, with a certain amount of rigor.
Therefore, there was no intent to control, select or rank the schools. Nor did it have to do with requiring that students pass a series of performance tests to check their preparedness for accreditation. The purpose, as noted, was much broader and comprehensive: it attempted to collaborate in the diagnosis of the schools to help them detect their strengths and weaknesses, so that, from a more precise understanding of their situation, they would be able to design projects for improvement and change.
Features of the evaluation
The school model evaluation was configured within a shared structure, in an attempt to provide benefits that would offset the effort. Therefore, it advocated a model in which information was returned in a manner quick and agile, comprehensive and balanced, able to reflect the reality of the school and to provide contextual information that would prevent inappropriate comparisons; to amplify the information the schools had about their reality, and finally, to help them promote programs for change and improvement (Marchesi 2002).
The characteristics of the NETWORKS evaluation model were:
a) External Evaluation
Unquestionably, and in the sense that the professionals who developed and applied the tests were actors from outside the schools themselves, we found ourselves looking at an external evaluation with the advantages and limitations this entails. This assessment was not intended to supplant that which the teachers were carrying out in their individual schools. However, it could be used in complement, in the sense that it provided a set of objective data, whose interpretation and evaluation had to be performed by the school’s own staff based on their own criteria. In a way, this evaluation could be expressed as an aid to that of the institution itself. It was the school staff who could best understand the importance of the results obtained, and could explain them more thoroughly, since they were the teachers who knew the history and culture of the school, its current or past problems and the decisions it has made. The combination of the two evaluations could result in a more nearly complete understanding of the educational reality of each case. As Tiana (1999) mentions, and fleeing from dichotomous-antagonistic classifications, we might speak of an external evaluation of a formative type (Marchesi and Martín, 1999b).
b) Contextualized information
Obviously, schools could be compared directly on the basis of scores obtained on various tests of performance, if these included students whose socio-economic and cultural origin is different. That would not comply with the principle of fairness proposed by House (1994). A fair comparison would involve neutralizing the effect which cultural and social background has on students’ performance. As several authors note, a solution to this problem would be to compare schools with similar characteristics; that is, to evaluate of the results as coming from a theoretically homogenous level (Webster, Mendro and Almaguer 1994; Fernández Díaz and González Galán, 1997; Tiana, 1997). In the NETWORKS model it was done that way. Each of these schools was classified in one of the four established contexts (high, medium high, medium-low and low), based on a student questionnaire about the profession of their parents, their studies, their employment status and some other related indicators. Consequently, the information provided to each of the schools was contextualized, since there was also presented data from the other schools that participated in this evaluation at the same time. On the one hand, they knew the average scores of all the schools, both at autonomous community level, and at state level; and on the other hand, they had the average scores of the schools with similar characteristics regarding the sociocultural context in which they had been classified. This allowed the schools to have a set of references for arriving at more meaningful conclusions. Figures 1 and 2, shown farther along in this work, give the separate examples of graphics presented to the schools, and in which appear the comparisons mentioned.
c) Objective information
The information from each school was obtained after the application of questionnaires and standardized tests, all previously analyzed, thus ensuring for them a high degree of reliability and validity.
d) Comprehensive and convergent information
In addition to offering information on the performance of students in different curricular areas, there were also evaluated their attitudes, satisfactions, metacognitive skills and learning strategies. Similarly, data were collected on the processes of the school and classroom, and the evaluations of the parents, teachers and students. Table I shows the main levels and dimensions of the proposed model.
e) Longitudinality
Fernández Díaz and González Galán (1997) point out the characteristics of effective school processes that may well be assumed by the NETWORKS evaluation model. In this type of evaluation it is considered that the improvement processes do not end with the implementation of school renewal; on the contrary, they never end; they are continuous processes involving successive adjustments to extend the objective of continuous improvement, under constant revision, and if need be, with new goals to reach. The results are not often immediate, and if they were, it would be necessary to evaluate the stability of the change. For that reason, many authors advocate longitudinal studies over several years (between three and five) so that the results, both positive and negative, can have some consistency and stability. The evaluation model NETWORKS is a process spanning four years longitudinally. This would allow offering information to schools about their own evolution, by comparing their progress from year to year. Thus, for example, in the case of students who in the academic year 1999-2000, were in the first level of high school, it would be possible to follow all their schooling in that educational level, since all their scores would be known from the beginning of Level 1 (first semester) to the end of Level 2 (last semester/first semester) and to the end of Level 4 (last level of high school). In this way, we would be approaching the concept of added value, since it would allow us to compare the students’ expected performance with their observed performance, and then analyze the differences. Goldstein and Spiegelhalter (1996) prefer to call this added value, “adjusted comparisons”, due to the influence of the context on student performance. Figures 3, 4, 5 and 6 show graphically what we have just observed, with the case of a particular school.
f) Confidentiality of data
The role of educational administrator, in this case the Department of Education of the Basque Country government, was, as well as the promoter, the facilitator and controller-supervisor. No accountability was contemplated by the schools evaluated, and indeed, one of the characteristics that it guaranteed was the confidentiality of the data. The information the different schools received was confidential, and could be known only by the school and the external evaluation team members, so that even the administration did not have access to it.
g) Formative Evaluation
The ultimate objective of this evaluation was to work together with schools so they could know themselves better and design strategies for change. From this point of view, we can speak of a formative evaluation. The functions of inspection and control are a long way from this assessment plan.
h) Interpreted by the schools themselves
The information provided to schools was descriptive, without interpretations. The analysis and interpretation of information had to be made by the schools themselves, since they better understood the scope of the results, and because they had a more accurate knowledge of the school’s history, culture, problems, and decisions that have been adopted.
i) Able to understand the factors that influence the quality of teaching
To the extent that the evaluation applied to a representative number of schools, it provided more scientific information on the relative influence of the different levels and dimensions that made up the evaluation model.
Design of the evaluation
As noted by Marchesi and Martín (1999a), the evaluation models applied might be very different, depending on the levels and dimensions to be included in them, and their characteristics. The simplest models were those that took into account only one dimension (Escudero, 1997), normally that of students’ academic performance, while the more complex models took into account the study of the sociocultural context, available resources, processes of the school and the classroom, students’ academic performance, and the school’s ratings of teachers as well as students and their parents. The evaluation design was based on the CIPP model (context, input, process, product/output), which takes into account those elements This model was better in practice than those other, simpler ones, but required more time and costs. Figure 1 shows the evaluation design schematic used in NETWORKS.
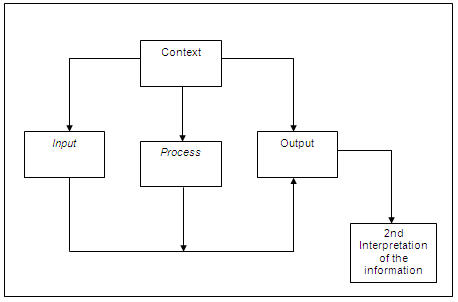
Figure 1. Schematic of the evaluation design of the NETWORKS model
(adapted from Reynolds, Teddlie, Creemers, Scheerens y Townsend, 2000)
Each of the four levels identified comprises several dimensions. Table I shows the dimensions selected in each of the levels.
Table I. Selected levels and dimensions in the NETWORKS evaluation design
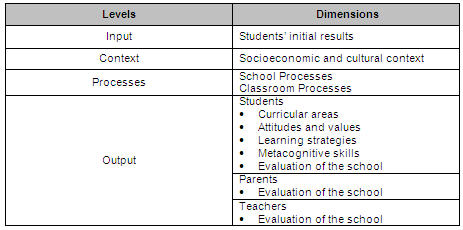
At the first level, the entry level, there were collected the preliminary results for students entering high school. This level was very important for knowing the changes that could take place over time, and for determining most reliably the added value of the school. The added value is the measurement of the improvement occurring in students’ performance in a school.
The level of context has to do with cultural and socioeconomic status. As mentioned on several occasions, all studies emphasize the influence of the socioeconomic and cultural context on the results obtained by students.
The process level includes the specific processes of the classroom and those related to the school’s organization and functioning. Some of the processes studied in this dimension of the school were the following: knowledge of how the school functions, participation, work environment, assessment of the management team’s functioning; functioning of seminars or teaching departments; expectations regarding the school and its students; and working conditions. In terms of classroom processes there were taken into account, inter alia, the planning of teaching, innovation in evaluation, the teacher’s ability to maintain an orderly work environment, etc.
The products level mainly emphasizes the students, but also incorporates the views of teachers and family. With regard to students, Marchesi (2002) notes that there is advocated a balanced and comprehensive concept of academic performance. Accordingly, in this model, students evaluated the learning of most curricular areas (Mathematics, Social studies, Natural Sciences, Technology, Spanish Language, the language of the country (Basque), and English, but also included metacognitive skills, their own learning strategies, and their attitudes. They also completed a questionnaire on how the school was functioning; in this questionnaire they assessed their relationship with the tutor, teachers and other classmates; extracurricular activities; skills and training received, etc. Parents, in turn, answered a questionnaire evaluating the operation of the school: the attention they received; the relationship with the tutor; the school’s order and discipline; the grades received by their children, etc. Finally, teachers expressed their level of satisfaction with the school’s operation, and the conditions in which they did their work.
An operational-type evaluation was carried out in the following five stages:
- The school’s commitment. The headship team collected information about the characteristics of the evaluation program. After the governing bodies of the school discussed and analyzed the program, they made the decision as to whether or not to participate in it.
- Data collection.
- Interview with the headship team about the report from its school.
- Interpretation of information by the school.
- Proposed change and evaluation of subsequent impact.
Those responsible for evaluation were aware that an external and quantitative evaluation, which seeks to provide relevant and contextualized information to schools by applying the same tests in all of them, allows for greater objectivity in the analysis of the results, and gives them a wider perspective of their situation, although this procedure has its limitations (Marchesi, 2002). First, the tests are shorter, and cannot replace the information that each teacher has about her? learners, and second, the excessive emphasis on the quantitative data can diminish the perception of the importance of the qualitative and internal evaluation done by the school. Therefore, we insisted that this external evaluation was only an aid to the evaluation necessary within each school, stressing that it must be they themselves that would interpret the information provided them. On the other hand, this quantitative information was complemented with the interview maintained with the headship teams.
Gathering the information
As mentioned previously, concerning the information collected, we tried to avoid collecting results at the level of performance in academic disciplines only. Thus, we incorporated other aspects such as students’ attitudes and opinions, learning strategies and metacognitive skills. In addition, facing a broader assessment that integrated the broadest points of view, we included teachers’ and families’ evaluations of how the school was functioning, and how teaching was developing.
The instruments applied were:
- Questionnaires: socio-economic and cultural context, attitudes, learning strategies, school and classroom processes (teachers), students’ and families’ opinion.
- Tests: Metacognitive Skills, Basque Language and Literature, Spanish Language and Literature, English, Mathematics, Social Studies, Natural Science, Technology, Geology-Biology and Physics-Chemistry.
The questionnaires applied were mostly Likert scales. Curriculum examinations were objective test that attempted to maintain a balance between the conceptual and the procedural.
One aspect that merits attention is the preparation of tests and questionnaires. The data collection tools were the same for all state schools, except the tests on Social Studies and the Language of the Community, for obvious reasons. In the first stage, these questionnaires and tests were prepared in the IDEA by test-construction experts and high school teachers who piloted the tests and performed the analysis of items and test, as well as matching, following the models of classical test theory and Item Response Theory or IRT.
According to the classification of Jornet and Suárez (1996), we can define the tests used as standardized tests of performance indicators, since they attempted to translate the levels of competence, which an institution, a school or educational system assumes to be goals to achieve in the educational process in the various disciplines and subjects.
In test production there is a very important component, educational mastery, to which they hoped to respond. Understood as educational mastery are the dimensions one attempts to measure within a subject or discipline. The term mastery was produced by experts in the subject matter in the field of evaluation, and has the support of specialists in measurement and evaluation. The role of these professionals is essential, since the work they do in the configuration and development of the tests comes to compensate, somehow, for the difficulties encountered because of the weak theoretical constructs often supporting them, and by the lack of proof for their unidimensionality. This is because the specific methodological proposals for empirical analysis of the results using dichotomous variables have yielded unsatisfactory results in identifying the dimensions, in many cases, based on the difficulty of the items and not on the contents (Jornet and Suárez, 1996).
Besides the work of experts in determining the theoretical importance and difficulty of the items, another key element was the technical quality of the tests. To ensure such quality, it was important to perform a psychometric analysis of the test, so as to guarantee its reliability and that of its items one by one. In this regard, and based on data provided by the pilot test, analysis of distractors constituted the central work in this area, because it allowed us to anticipate and manage any difficulties that might arise in the final application of the tests. Along with this, analysis of potential bias was also a key element for ensuring the validity of the tests.
Finally it could be concluded that the standardized tests being applied were based on a correct approach, since being planned for extensive and diverse populations they were not interpreted individually; on the other hand, we considered the selection of indicators, the analysis of items, and the proof of reliability and validity checks to be sufficient. To this we should add another element we consider very important—that which has to do with the proper use of the evidence, by which we attempt to have a more formative than summative dimension on which to base decisions about the group, and not about individuals.
The information that until then had been offered to the institutions participating in the evaluation was regulatory, in the sense that each knew its position in relation to the rest of the participating institutions.
In order to complete the normative character of the test interpretations, there were also established standards and cutoff scores on the performance tests, as is done on criterion-referenced tests, so that using the standards established we could determine the level at which we could classify the students as competent or incompetent in the performance variable considered.
In this context, and taking into account the importance possessed by the variable sociocultural context of families, work is currently being done with the aim of being able to offer different standards for different levels. The process followed in establishing those standards and the influence of sociocultural context on them, are specified in detail in an article by Lizasoain et al. (in press) which will shortly be published.
Steps followed in the collection of data:
The tests and questionnaires relating to first-level high school education were applied in October, i.e. the beginning of school at this stage. Along with these, data was collected to determine the socio-cultural context by means of a questionnaire applied to all students of 1st, 2nd and 4th levels of high school. The application of these tests at the beginning of the course was aimed at making an initial assessment of students; this would be valid for the teachers of that course (in the sense that these first data could adjust the programs to the real situation), and for the school itself, so that over a period of four scholastic years the progress of those students could be appreciated.
Before the data was collected, a meeting was held in each of the schools; involved were the school principals, high school teachers and the evaluation team. In that meeting the school was informed about everything related to the evaluation plan that would be implemented: objectives, characteristics, types of tests and questionnaires, dates and phases of data collection, and so on. It was at this time that various aspects of the evaluation could be negotiated. Thus, the meeting was very important because it laid the foundation for the climate of collaboration (between the schools, and in this case the evaluators) needed to meet the established objectives.
During the months of January and February the students of 2nd and 4th levels filled out the questionnaires on attitudes and opinion; the faculty, the questionnaires about the processes and the classroom; and the families, the questionnaires regarding their assessment of the school. Finally, in May, performance tests were applied to students in the 2nd and 4th year of high school.
Dissemination and expansion of information
For the distribution of information, evaluation reports are used; preparation of these represented the fulfillment of the evaluation’s basic task, that is, transforming data into evidence (Sáez, 1995). In these reports, produced in the NETWORKS model, there was an attempt to follow these guidelines:
- Include all information needed by the different audiences.
- Try to be pertinent and relevant.
- Return the reports as soon as possible (in the same quarter in which the tests are applied)
- Try to be brief and concise.
- Use accessible language.
- Use various communication resources such as tables, graphs and so forth.
- Do not include recommendations, since that is considered to be a task for the recipients of the report.
- Use an expository style.
For this, two meetings of the evaluator with the school director were held during the school year, one in November and another in June. In these meetings the results were delivered.
Each year two reports were delivered to each school: in November, one with student results of Level 1, and another in June with the results of Level 2 and 4 tests applied by teachers; evaluations made by students and parents. They were simple reports, essentially describing the data presented, without any evaluation. Possible interpretations were left for the meeting of the persons in charge. The structure of the reports was as follows:
- Explanation of the data on the school’s sociocultural context.
- Individual scores for each student in the different areas evaluated. In addition to the total scores, subscores were collected in each of the subareas.
- Scores on the students’ attitudes, and evaluations of the school made by the students, teachers and families, both overall and sectorial.
- Average scores, and histogram for the average scores in each of the areas, and for each group/class of each level (1st, 2nd and 4th.)
- Table showing the school’s points in each of the areas and sub-areas by group/class, along with the average scores of the schools classified in the same sociocultural context.
- Polygon of frequencies in which are reflected graphically and numerically the mean score of the specific school, schools of the same sociocultural context within the autonomous community, the total of those of the community, of schools of the same social context within the Spanish State, and the total of those that participated in the evaluation within the State.
- Description and schematic of each of the tests, to be used in interpreting the results.
- Explanation of the report and of the most important findings.
As we have pointed out above, it is the schools themselves that had to make timely interpretations and evaluations based on their own criteria. Therefore, one of the most important objectives of the meetings held for delivering and presenting the results was concerned with orientation in this interpretation and helping to establish projects for change and improvement.
Below are examples of two graphs that appeared in the reports (see Figures 2 and 3). The first shows the results of the questionnaire “School Processes” filled out by teachers, compared with the results of the schools of their own contexts, and with those of all the schools of the Basque Country (BC) and the State of Spain.
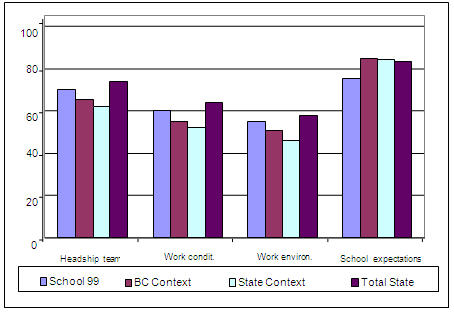
Figure 2. Results obtained for the school by means of the questionnaire
“School processes” (dummy data)
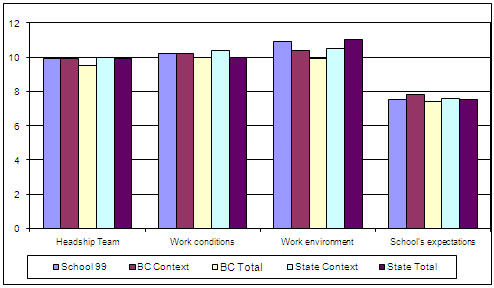
Figure 3. Results obtained by the school on the Social Studies test
of Level I compulsory high school education (dummy data)
Figure 3 shows the results obtained by the school on the Social Studies test for CHS Level 1 students, compared with the results obtained in the establishments of the same context and with those of all the schools of the Basque Country (BC) and the State of Spain.
However, when a school completed the full four years of the evaluation program, it received a final report describing what happened during that period. Basically, the structure of the report was similar to that of other progress reports, except that it offered a series of graphs that summarized the results obtained during these four scholastic courses in 1st, 2nd and 4th year of CHS (Figures 4, 5 and 6) in each of the dimensions evaluated. Also included was a final graphic that showed the route followed by the students to whom the evaluation program was applied in the first year, CHS Level 1, and at the end of the evaluation program had completed Level 4 (see Figure 7.) By means of that figure, one could get an idea, though not entirely accurate, of the added value of the school in question.
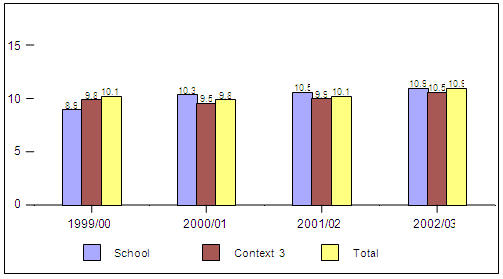
Figure 4: Mathematics CHS Level 1
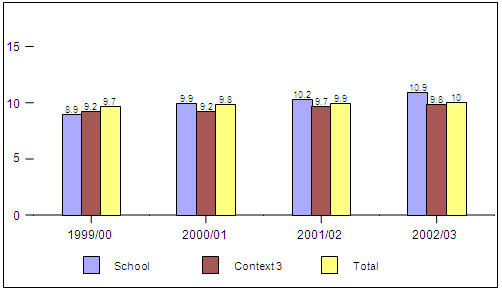
Figure 5. Mathematics CHS Level 2
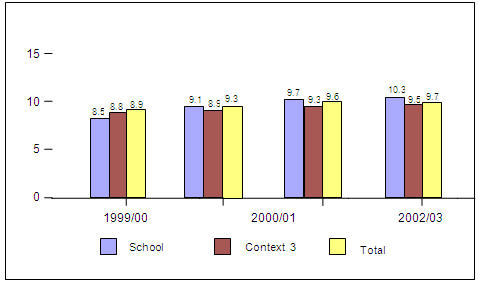
Figure 6. Mathematics CHS Level 4
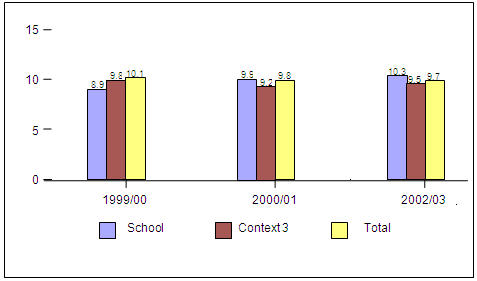
Figure 7. Development of mathematics
(the same group of students in Levels 1, 2, and 4)
Decision-making and improvement plans
Today no one doubts that one of the conditions an evaluation must meet is that it offer information and evidence to decision-makers. That is, it gives priority to the utilitarian element of the evaluation. As noted by Tiana (1997) it is assumed that an evaluation should provide those responsible for a school or program with rigorous, valid and reliable information, from which they will make necessary decisions. However, this view is criticized as naive because of the low incidence of evaluation in decision-making processes. In fact, today it is considered that the relationship between the two practices is much more complex. The decision-making process relies on various elements and of diverse kinds, such as those Tiana (1997) mentions:
- Direct or indirect information from various sources and with varying degrees of relevance and reliability in each case;
- Normative, institutional or personnel factors which determine the existing margin for maneuvering;
- Information about the context of interpersonal relationships, anticipating the reactions that may occur;
- Multilateral negotiations so that all the actors involved feel themselves to be co-participants in the decision adopted.
That is, we move in a reality where information and knowledge are necessary but not sufficient, since the ability to negotiate and mobilize the will, the sense of opportunity and even the intuition are also very important. In order to facilitate this work, the evaluation model NETWORKS proposes a series of guidelines for making evaluation a tool for improvement. These are summarized below.
Evaluation is only a first step, an initial photograph that reveals the whole and each of the parts with some precision. It displays the strong contours and the blurred ones.
But this photograph is unable to speak for itself; we must learn to see, understand and interpret it, which requires the participation of the headship and the faculty of the school. Therefore, as mentioned on several occasions, the confluence of internal and external evaluation is a guarantee for a better understanding of the school.
However, this step is not the last. So that evaluation can help to generate processes of change and improvement, it is necessary to take at least two steps. The second is to interpret and use properly the information obtained. The third is to promote projects or initiatives for change. A final step that completes the circle is to re-evaluate, in order to confirm the dynamic being produced (see Figure 8).

Figure 8. Process of evaluation and change
Ensuring that information from the evaluation be made available to most of the people involved in the school’s operation will enable the promotion of change processes—provided, of course, that the people receiving the information are able to interpret it correctly so as to benefit the work of teachers and the school.
Proper use of the information is already an important part of the change process. Reflection shared between the various members of the educational community, especially the headship teams and those of teachers, will help to arouse awareness of the situation and to change attitudes, teaching styles and ways of working. Similarly, parents and students modify their attitudes and expectations toward the school when they feel part of the evaluation process.
However, while we acknowledge its undoubted interest and advantage, we must assert that this collective analysis must go one step further, lead to reinforcing the positive aspects of the school, and to resolving the problems diagnosed. As noted in the previous paragraph, it is the work of the headship team to determine the possible projects for improving the school and to establish the objectives, periods, conditions, responsibilities and actions to accomplish them. But we must never forget that changes in education are slow and laborious, and there are many conditions which must be taken into account (the school’s culture, the attitudes of its teachers, the time available, human relations, professional expectations, etc.), since on them will depend the eventual success or failure of the plan of action. On them depend the scholastic community’s increase of satisfaction and morale.
Recommendations
In conclusion, we present a series of suggestions which we think can help improve the NETWORKS evaluation model.
- If the evaluation model NETWORKS paid attention only to the products, it would be applying an economistic model that would undermine the very concept of education. Taking into account the background as well as the products, would be to use an effective approach to measuring the performance of the system, but a limited one. This is because the detection of problems cannot always pinpoint their location, or show how to solve them. Therefore, any assessment model such as NETWORKS should be devoted also to the process, as this will allow us to obtain a focus more educational and complete for real improvement in the school. Therefore, although the NETWORKS model also contemplates the process, it is desirable that it give it a higher specific weight
- Most schools agree with this program of evaluation. In this regard, see the article by Lukas et al. (2000), which gives more information about the meta-evaluation performed. It can be seen, among other things, that the majority of the students want to follow, but have difficulty in exploiting the information so as to establish processes for improvement. External evaluators must use part of their energies for helping schools in the distribution and dissemination of the information obtained, for interpreting it, and for establishing change and improvement processes.
- There is a need to complement external evaluation with self-evaluation by the school, which most of the time is not done; in most cases because of lack of teacher preparation. Therefore, as Escudero (1997) notes, educational authorities should promote the training of evaluators, above all among teachers, because you cannot continue to demand and construct models based on the participation of school personnel, if teachers do not receive adequate technical preparation for them.
- The complementarity between external and internal evaluation can be performed as follows (Matthew, 2000, p. 190): a) External evaluation should start from the documentation generated by the internal; b) some external agent should be involved in the internal assessment; c) in the external, something internal; d) the two reports, internal and external, should be merged into a final one agreed upon by both parties; e) on proposals for improvement both external and internal agents should participate on equal terms.
- Evaluation of the school should take into consideration the aspect of contextualization, so as to adapt it to its objectives, environment, possibilities, etc., in order to seek its improvement as an individual institution. However, standardized programs such as NETWORKS sometimes make it difficult to obtain significant benefits for each school, according to its situation and its particular needs. We therefore, and once again, underline the need to complement the external evaluation provided by NETWORKS with self-assessment by the school.
- Although the NETWORKS model for four years has delivered to each school eight reports, and kept track of the distribution of these, it would be appropriate to propose a change of perspective where the term distribution would be changed to dissemination, i.e. trying to convey “the message that evaluation must deposit its seed of improvement in those areas more willing to make it fruitful” (Tiana, 1997, p. 34). To do this, it is necessary to adopt a proactive stance and use a variety of communication resources that would ensure the distribution or dissemination of information over the various audiences involved in the school.
- Until now, comparisons of schools have been of a normative type. That is, each school is compared in the different dimensions evaluated, with the rest of the schools in its context or community. This information, while interesting, is not enough. It is true that after four years of evaluation the school receives additional information about the progress its students who entered CHS Level 1 and reached Level 4, as an approximative attempt to see what has been the school’s added value. That is, it is an idiographic comparison in which the students are contrasted with themselves. However, this aspect should be more fully explored, using the Theory of Item Response models to obtain models that would more clearly point out the added value of each school. Experiments can also be done with of latent growth curve models, emerging statistical applications presented at the symposium Statistical Models for the Study of Change in the XI National Congress of Educational Research Models organized by the Inter-University Educational Research Association (AIDIPE) in partnership with the University of Granada (Spain). Finally, to complete the comparisons, it would be appropriate to establish standards and cutoff points for each of the curriculum tests using technical means such as those commonly used in the preparation of the criteria tests. Thus, a school could have three benchmarks, based on which the interpretation of information could be fairer and closer to reality.
References
Coleman, J. S., Campbell, E., Hobson, C.J., McPartland, J., Mood, A.M., Weinfeld, F.D. et al. (1966). Equality of educational opportunity. Washington, DC: U.S. Government Printing Office.
De Miguel, M. (1997). La evaluación de los centros educativos. Una aproximación a un enfoque sistémico. Revista de Investigación Educativa, 15 (2), 145 178.
Escudero, T. (1997). Enfoques modélicos y estrategias en la evaluación de centros educativos. Revista Electrónica de Investigación y Evaluación Educativa, 3 (1). Retrieved February 10, 2004, from: http://www.uv.es/RELIEVE/v3n1/RELIEVEv3n1_1.htm
Fernández Díaz, M. J. & González Galán, A. (1997). Desarrollo y situación actual de los estudios de eficacia escolar. Revista Electrónica de Investigación y Evaluación Educativa, 3 (1). Retrieved January 15, 2004, from: http://www.uv.es/RELIEVE/v3n1/RELIEVEv3n1_3.htm
Goldstein, H. & Spiegelhalter, D. J. (1996). League tables and their limitations: Statistical issues in comparisons of institutional performance. Journal of the Royal Statistics Society, 159, 385-443.
House, E. R. (1994). Evaluación. Ética y poder. Madrid: Morata.
Jencks, C. S., Smith, M., Acland, H., Bane, M. J., Cohen, D., Ginits et al. (1972). Inequality: A reassessment of the effect of family and schooling in America. New York: Basic Books.
Jornet, J. M. & Suárez, J. M. (1996). Pruebas estandarizadas y evaluación del rendimiento: usos y características métricas. Revista de Investigación Educativa, 14 (2), 141-163.
Lizasoain, L., Joaristi, L., Santiago, C., Lukas, J. F., Moyano, N., & Sedano, M (in press). Establecimiento de estándares y puntos de corte en pruebas de rendimiento. Una aplicación en el área de Matemáticas de 2º y 4º de ESO. Bordón, 56 (2).
Lukas, J. F., Santiago, C., Munarriz, B., Moyano, N., & Sedano, M. (2000) Euskal Autonomia Erkidegoko ikastetxeen kanpo-ebaluazioa. Tantak, 24, 39-63.
Marchesi, A. (2002). El proyecto REDES. In A. Marchesi & E. Martín (Comps.), Evaluación de la educación secundaria. Fotografía de una etapa polémica (pp. 21-33). Madrid: Fundación Santa María.
Marchesi, A. & Martín, E. (1999a). Tendencias actuales en la evaluación de los centros docentes. Infancia y Aprendizaje, 85, 5 18.
Marchesi, A. & Martín, E. (Coords.). (1999b). Una red de evaluación de centros de educación secundaria. Infancia y Aprendizaje, 85, 59 73.
Marchesi, A. & Martín, E. (Comps.). (2002). Evaluación de la educación secundaria. Fotografía de una etapa polémica. Madrid: Fundación Santa María.
Mateo, J. (2000). La evaluación educativa, su práctica y otras metáforas. Barcelona: ICE Horsori.
Pérez Juste, R. (1999). Nuevas perspectivas de gestión, control y evaluación. Bordón, 51 (4), 449 477.
Reynolds, D., Teddlie, C., Creemers, B. P. M., Scheerens, J., & Townsend, T. (2000). An introduction to school effectiveness research. In C. Teddlie & D. Reynolds (Eds.), The international handbook of school effectiveness research (pp. 3-25). London: Falmer Press.
Sáez, M. J. (1995). Caracterización y problemática de los informes de evaluación. In M. J. Sáez (Ed.), Conceptualizando la evaluación en España (pp. 83 93). Madrid: Servicio de Publicaciones de la Universidad de Alcalá.
Tiana, A. (1997). Tratamiento y usos de la información en evaluación. Retrieved January 20, 2004, from: http://www.campus-oei.org/calidad/tiana.htm
Tiana, A. (1999). Ikastetxeen kanpo ebaluazioa Aukerak eta mugak. Tantak, 21, 7 32.
Webster, W. J., Mendro, R. L., & Almaguer, T. O. (1994). Effectiveness indices: A “value added” approach to measuring school effect. Studies in Educational Evaluation, 20, 113 145.
Translator: Lessie Evona York-Weatherman
UABC Mexicali
Please cite the source as:
Lukas, J. F. & Santiago, K. M. (2004). Evaluation of high schools in the Basque Autonomous Community. Revista Electrónica de Investigación Educativa, 6 (2). Retrieved month day, year, from: http://redie.uabc/mx/vol6no2/contents-lukas.html